Table of Contents
In the general menu, select the tab.
The module allows for the following operations, available depending on the software version:
-
Graphical and technical analysis of instruments based on their "end of day" or "intraday" prices.
-
Real-time monitoring of market evolution.
-
Real-time detection of programmed alerts.
- Graphical analysis of the results of implemented strategies (see chapter Trading Systems).
- Placing stock orders to a broker (see chapter Order Placement).
-
Real-time monitoring of all transactions for a list of instruments.
The module allows you to open, simultaneously within the same workspace at a location chosen by the user and on one or more monitors connected to the computer, the following windows:
|
Chart Windows |
Each chart window displays the prices of a chosen instrument (the same instrument can be present in multiple chart windows simultaneously). |
|
Price Tables |
Depending on the version, two or more |
|
Screeners |
Depending on the version, one or more |
|
Rankings |
Depending on the version, two or more |
|
Order Books |
Each order book displays the best real-time offers and demands for an instrument. Two forms of order book presentation are available: tabular or histogram format. |
|
Transaction Lists |
Each transaction list displays in real time the transactions of the current session for an instruments. |
|
TickFlow |
The TickFlow window displays in real time all transactions executed on the exchange for a list of instruments. |


Note
There is no limit to the number of chart windows, order books, and transaction lists that can be opened simultaneously.
Example of a workspace organization:
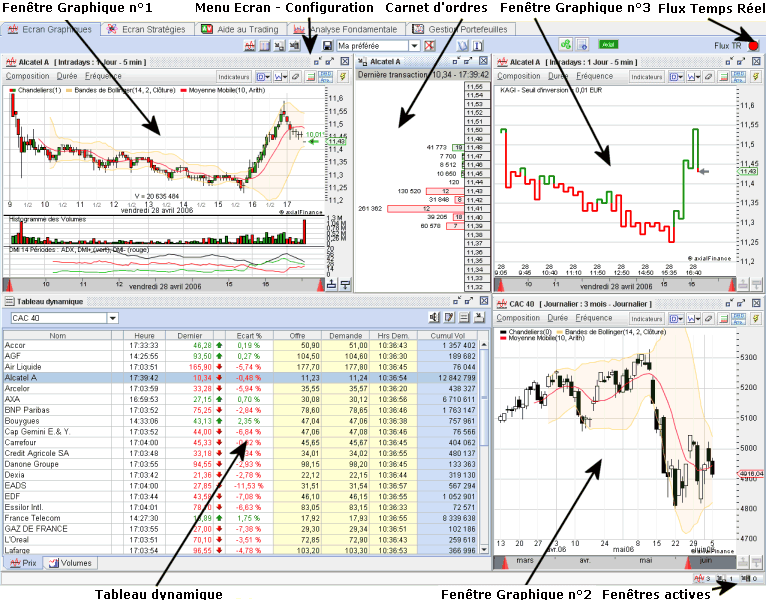
The area includes a set of buttons in its upper part to open the different windows (this is also possible from the general menu , option ), an instrument search field, and the real-time feed status button.

|
To add a chart window to the currently open workspace. Upon opening a new chart window, its configuration is that defined by default in the menu and the prices are those of the instrument selected in the instrument list. The configuration and the instrument may subsequently be modified. |

|
To open a price table. |
 |
To open a screener. |

|
To open a ranking. |

|
To open an order book in tabular format for the instrument selected in the instrument list. |

|
To open an order book in histogram format for the instrument selected in the instrument list. |

|
To open a transaction list for the current session of the instrument selected in the instrument list. |

|
To open the TickFlow window. |

|
To open the trading portfolio. |
 |
To display the selected broker and the connection status (Red = closed, Green = open). In the event that the connection to the broker is interrupted (button turns red), click on this button to reset it. |
 |
On the far right, the Real-time Feed button indicates the status of the feed (green for open and red for closed) and, if necessary, allows commanding the opening and closing of the feed. |
Important
To delete a window from the currently open workspace, two methods are possible:
-
For permanent deletion, click on the cross in the top right corner of the window and then re-save this workspace from the general menu. Without the re-saving command, the window will reappear when this workspace is recalled.
-
For temporary deletion, minimize the window to an icon by clicking on the button located in the top right corner of the window.

The central area contains the various windows open in the current workspace.
At the bottom, a status bar remembers the labels of the workspace windows that have been minimized. To the right of this status bar, a set of counters indicates the number of windows open of each type:

The dimensions of chart windows, price tables, order books, and transaction lists are adjustable by the user. By selecting a window edge with the mouse cursor, it changes into a horizontal or vertical arrow. While holding down the left mouse button, drag vertically or horizontally to obtain the desired dimension.
To move a window, press and hold the left mouse button on the top border. While holding it, move the mouse cursor to the desired location.
To facilitate precise window positioning, Axial Finance is equipped with an automatic snapping system. When a window's vertical or horizontal edge approaches an edge of the area, releasing the left mouse button causes the window to snap against that edge.
For each workspace, the dimensions and positions of the windows are kept in memory.
In the case of a hardware configuration with multiple monitors or a single very large screen, it may be useful to be able to detach windows from the area occupied by to position them outside.
Axial Finance possesses a window detachment feature.
Each window has a button in the top left corner:
![]() which, when clicked,
allows detaching the window and subsequently reattaching it to the area.
which, when clicked,
allows detaching the window and subsequently reattaching it to the area.
When multiple windows are open in a workspace, it is often useful to link certain ones so that they always display the same instrument with different durations or frequencies. Once the windows are linked, any change of instrument in one of them also applies to all other linked windows.
Axial Finance provides this linking capability and allows for defining multiple independent groups of linked windows.
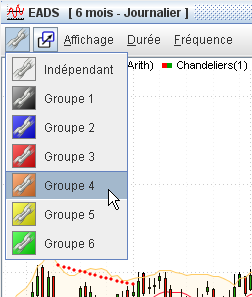
|
In the upper left corner of the window, a button representing a chain opens a menu allowing you to choose one of six groups. Each group is symbolized by a colored chain. All windows having a chain of the same color will be automatically linked together. It is possible to define six distinct groups of linked windows. To remove a window from a group, select the first option in the dropdown list. |
 |
A workspace is defined by:
-
Its name
-
The different windows that compose it (in positions and dimensions)
-
The instruments or list of instruments selected in each window
-
The composition of chart windows: duration and frequency of the chart prices, selected technical indicators
To save or re-save the currently open workspace, choose from the general menu the option and then choose:
-
and subsequently define the name of this workspace
-
or the name of the open workspace (shown in bold) to re-save it
To recall a memorized workspace, click on its name in the list of workspaces in the general menu .
Important
When changing a workspace, any modifications made to the workspace that is about to be closed will not be automatically saved. To find them upon reopening this workspace, it is necessary to save them before changing workspaces.
To delete a workspace, choose from the general menu the option and then click on its name.
Note
There is no limit to the number of workspaces that can be created.
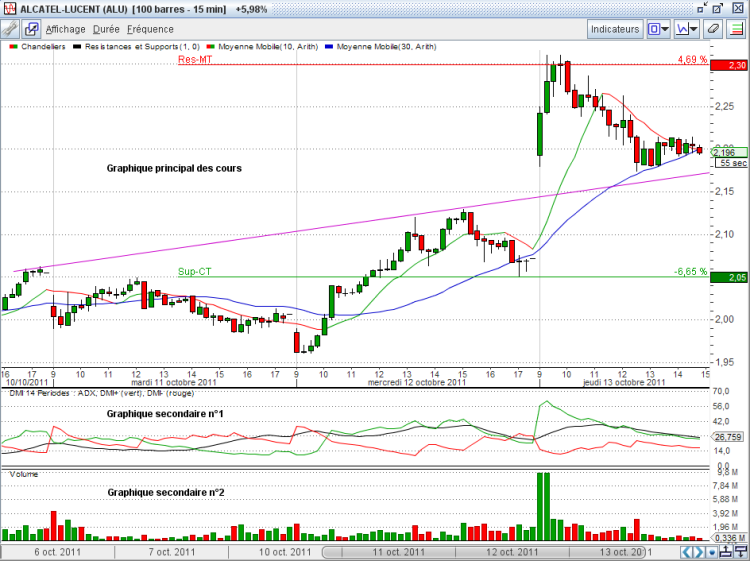
Each chart window includes the following elements:
Menu with options:
|
|
to open the window for selecting and configuring the technical indicators of the chart |
|
|
to choose the type of vertical scale for the main chart (linear, logarithmic) |
|
Open order book |
to add the order book transmitted by the real-time feed to the chart (only in the case of an intraday duration chart) |
|
|
to enter or modify the resistance and support levels of the instrument in the chart |
|
|
To display the graphical analysis performed by Day By Day as well as recommendations (if a valid subscription is active). |
|
Real-time alerts |
to open the dialog window for adding or modifying a real-time alert on the instrument in the chart. |
|
Real-time strategies |
to open the dialog window for defining, activating, and disabling the execution of a strategy in real time and opening/closing positions in the trading portfolio. |
|
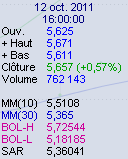
Show trading zone |
to make the trading zone appear at the top of the chart, where real-time data is displayed and the command for placing an order with a broker is located. |
|
|
to hide/unhide the chart menu (allowing you to increase the available surface area for the chart within the chart window) |
|
|
to hide/unhide the time cursor at the bottom of the chart (allowing you to increase the available surface area for the chart within the chart window) |
|
|
To define a specific style for this chart window and not use the general default style defined in the general menu option . |
|
|
To add a new chart window identical to this one into the currently open workspace. |
|
|
to draw lines, segments, channels, ellipses, rectangles, triangles, arrows, and Andrews' forks in the chart |
|
|
to enable (or disable) the precise positioning mode for the ends of drawings in the chart. |
|
|
to open the text entry dialog window for the chart |
|
|
to select options related to drawing Fibonacci curves, Gann curves, or the Speed Line. |
|
|
to clear from the chart any signals drawn during the application of a signal, a rule, a strategy, or the detection of real-time alerts. |
|
Dividend adjustment |
to enable/disable the adjustment of prices with distributed dividends. |
|
|
to reload into the chart and save in the software's database the entirety of the available price history (if a valid subscription is active). |
|
|
to open the notepad for the instrument, allowing you to keep a free-text note (maximum 2000 characters per instrument) |
|
|
to resize the chart directly to the dimension defined during the last export. |
|
|
to open the window for exporting the chart as an image file |
|
|
to send the chart image via email to one or more recipients. |
|
|
to consult the "Chart Window" chapter of the user manual |
Note
The options in the menu are also accessible via the context menu that opens when right-clicking within the chart.
Menu to define the duration of prices displayed in the resting position of the time cursor. This duration will be automatically adjusted when using the time cursor (see below).
|
Menu with options:
|
These buttons allow direct control of the most frequently used functions:
 |
To open the selection window for technical indicators to be displayed in the chart |
 |
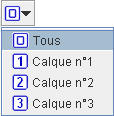
To choose from the dropdown menu the number of the layer of the chart window (see the definition of the concept of layer in the paragraph Multi-plane Drawing Mode) |
 |
To choose from the dropdown menu the type of drawing to perform (segment, channel, arrow, horizontal, circle, etc) |
 |
To activate the eraser function, allowing you to erase technical indicators and drawings on the chart |
 |
To define and display the 6 resistance and support levels for the instrument in the chart |
The main chart displays the prices of the instrument and the technical indicators whose vertical scale is identical to that of the prices (for example, moving averages, Bollinger bands).
Below the main chart, a maximum of 4 secondary charts can be added to display other technical indicators.
The time cursor is located at the bottom of the chart window:

It allows you to move the chart horizontally along the timescale and zoom in on any time interval.
To display the prices of an instrument in a chart window, its selection is made from the instrument list on the left side of the screen.
Two modes of operation are available: or . The choice of mode is made in the general menu , option . The first mode is more direct but every click will trigger a change of instrument, whereas in some cases the reason for the click might be different. This first mode has the advantage of allowing rapid scrolling through a instrument list by pressing the Up or Down keys on the keyboard.
When multiple chart windows are open, you may want to change the instrument in only one window or in several of these windows at the same time. To define a group of windows linked together, see the procedure defined in paragraph Linking Chart Windows Together.
By clicking or double-clicking (depending on the chosen mode) on an instrument from the reference list, this instrument will be assigned to the selected window and to all other windows in its linked group.
Alternatively, the Drag and Drop method is also available for assigning an instrument to a group of linked windows. You select the instrument in the instrument list, then while holding down the left mouse button, drag it over a chart window of the group and release the button.
Note
It is also possible to type the mnemonic code of the instrument on the keyboard to display it directly in the previously selected chart with the mouse. For example, if the exchange Euronext Paris is selected in the instrument list, to display L'Oréal, you simply type OR. If another exchange is selected, you must then add a space and the country code after the mnemonic code, such as ALU FR.
To display technical indicators in the chart, click on the button in the icon bar to open the dialog window below.
This dialog window can also be opened from the chart's context menu (right-click in the chart) or from the menu.
This dialog window includes two tabs for choosing the technical indicators for the or for the .
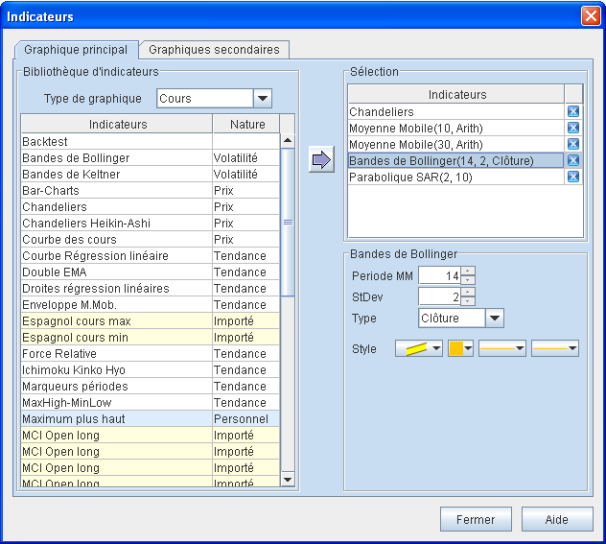
-
In the dropdown list, select the type of representation: Classic, Point and Figure, Kagi, Renko, or Line Break.
-
Next, transfer the technical indicators from the on the left into the frame on the right. To transfer, double-click the technical indicator or select it and click the
 button.
The same technical indicator can be added to the chart multiple times.
To remove a technical indicator, select it in the frame and click the
 button,
or press the Del key on the keyboard.
button,
or press the Del key on the keyboard.
-
For each technical indicator, define its curve style and parameters by selecting it in the frame. The available parameters are displayed directly below, along with possible styles. For each curve composing the indicator and depending on its nature, the style allows for:
-
choice of curve shape: continuous single-color line, continuous red/green bicolor line, series of bicolor dots, series of red/green bicolor dots, colored band, single-color histogram, bicolor histogram, ...
-
choice of color
-
choice of line thickness
-
choice of dotted line type
-
Note
Removing a technical indicator from the chart can also be done directly by clicking the eraser button at the top right of the chart window and then clicking the name of that indicator in the chart legend.
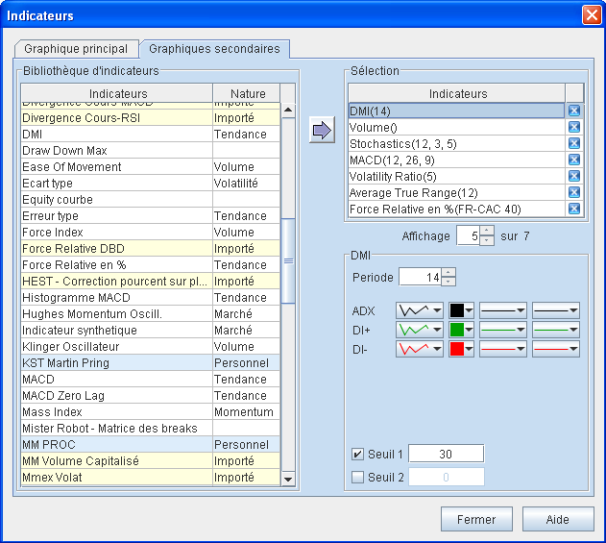
A large number of technical indicators are available in Axial Finance for display in the secondary charts.
A maximum of four secondary charts can be visible simultaneously within the
chart window, below the main chart.
When the number of technical indicators selected
is greater than the number of visible indicators, a Slideshow
system allows them to scroll vertically.
To do this, click on the ![]() and
and
![]() buttons to scroll vertically
in either direction.
buttons to scroll vertically
in either direction.
-
Transfer the technical indicators from the on the left into the frame on the right. To perform this transfer, double-click the technical indicator or select it and click the
button.
The same technical indicator can be added to the chart multiple times.
To remove a technical indicator, select it in the frame and click the
button,
or press the Del key on the keyboard.
-
For each technical indicator, define its parameters by selecting it in the frame and choosing from the available parameters displayed directly below.
For each technical indicator, you can add two threshold lines by checking the corresponding boxes and entering the threshold level.
-
Define the number of secondary charts visible simultaneously (maximum of 4). Choose a value from 0 to 4 in the box.
The height of each secondary chart can be modified by placing the mouse pointer above the horizontal separator line between these charts and dragging vertically with the mouse button held down.
When the mouse is inside a secondary chart, the two buttons
 and
and
 appear in the top right corner of the secondary chart.
Clicking on the icon
permanently removes this secondary chart from the
chart window (an action identical to deleting an
technical indicator with the eraser).
Clicking on the button
(this button is only present if multiple secondary charts are open)
will cause this chart to occupy the full height of all visible secondary charts,
with the other secondary charts being temporarily hidden.
To display all secondary charts again, click on this button once more.
appear in the top right corner of the secondary chart.
Clicking on the icon
permanently removes this secondary chart from the
chart window (an action identical to deleting an
technical indicator with the eraser).
Clicking on the button
(this button is only present if multiple secondary charts are open)
will cause this chart to occupy the full height of all visible secondary charts,
with the other secondary charts being temporarily hidden.
To display all secondary charts again, click on this button once more.
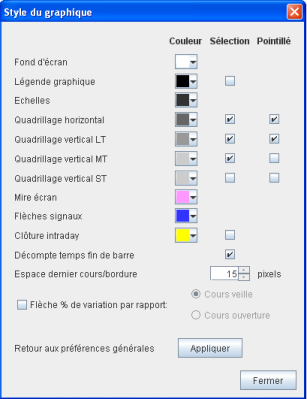
The style of the chart windows (background color, grid, etc.) can be defined at two different levels:
-
In the general menu , option . In this case, the chosen style will apply to all charts except for those for which a specific style has been specified.
-
In the menu, option of the chart window, to specify a specific style for this window. When a specific style has been specified for a window, it will retain that style until a return to the preferences' general style is requested by clicking on the button present in the style definition window.
Style elements:
 |
|
The vertical scale of the main chart is automatically determined by default to best adjust the price plot to the available height of the chart window.
To modify the maximum and minimum graduations of the scale, press and drag vertically with the mouse within the scale area:
-
By starting to press in the upper part of the scale, the maximum graduation will be modified.
-
By starting to press in the lower part of the scale, the minimum graduation will be modified.
When the maximum or minimum graduations have been changed by the user, a light blue vertical line at the left edge of the scale indicates this change, and the vertical ends of this blue line indicate the maximum and minimum graduations calculated in automatic mode.
After a modification to the scale, double-click within the scale area to return to automatic mode.
To choose a logarithmic or linear vertical scale, select this mode in the menu of the chart window, under the option, then or .
The time cursor allows you to move the chart horizontally along the timescale and zoom in on any time interval.
This cursor consists of two parts:
-
The main part with the scale graduations and the cursor for controlling the horizontal movement of the chart. This movement can be performed in several different ways:
-
By clicking and dragging the center of the cursor with the mouse, the entire chart shifts to the right or to the left.
-
By clicking and dragging the left end of the cursor, the left origin of the prices is shifted, while the position of the last price on the right remains unchanged.
-
By clicking and dragging the right end of the cursor, the right end of the prices is shifted, while the position of the first price on the left remains unchanged.
-
By moving the cursor beyond the right or left end, fast scrolling of the chart is triggered.
-
-
On the right are three buttons:
-
 to shift left by a single bar per click
-
 to shift right by a single bar per click
-
 to return the chart to its resting position
-
The resting position of the chart corresponds, for the selected duration and frequency, to the positioning of the prices across the entire width available in the chart windowwindow. For example, if a duration of 6 months with a Daily frequency is selected, the resting position displays the last 6 months of prices across the available width. Subsequently, using the time cursor allows you to go back in time as far as the origin of the prices present in the software's database.
In the case of intraday frequency charts (tick-by-tick, seconds, minutes, or hours), the duration of the available history in the chart depends on the selected duration. The larger the duration, the further back in time it will be possible to go. For example, by selecting a duration of 2 days, it will be possible to go up to 5 days back at most. To go beyond this, one must select a longer duration, such as one week.
By pressing the left mouse button on the chart surface and moving it, Axial Finance displays a cursor (vertical-horizontal lines) as well as a label with details of the price, the date of the vertical line, as well as the values of the indicators present in both the main chart and the secondary charts:
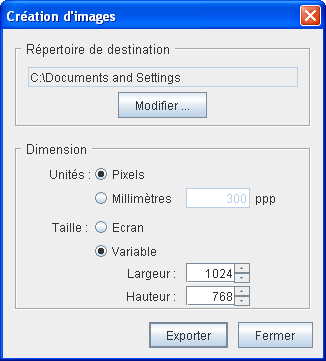
The chart can be exported as a PNG (Portable Network Graphics) image file. The user then has the possibility to include this chart in a document or transmit it in an email.
The image can be exported:
-
with the same pixel dimensions as the currently open chart window
-
with a different dimension set in pixels or centimeters
 |
|
Axial Finance allows for an unlimited number of segments, lines, texts, rectangles, triangles, circles, Fibonacci figures, Gann figures, etc. to be inscribed in the charts.
These drawings are automatically saved in memory and reappear automatically upon selecting the instrument.
To perform a drawing, you can:
-
either in the icon bar of the chart window, choose from the dropdown menu at the
icon the type of figure to draw,
-
or choose from the menu of the chart window the option and then the type of figure to draw.
Important
As soon as a figure type is selected for drawing, the mouse pointer changes into a cross to signify the activation of this function, and a label attached to the cursor indicates the chosen figure. Upon completion of the drawing, this function remains active, allowing you to draw another figure of the same type, and so on. To terminate or interrupt the drawing function, click in the chart with the right mouse button or press the Esc key on the keyboard.
Axial Finance allows for the implementation of a multi-layer mode, also known as layers mode.
With this drawing mode, the user can decide to draw different graphical figures in a particular layer, on the understanding that these drawings will be invisible when the chart is requested for another layer. Six different layers are available.
For a single instrument, an analysis inscribed in one of the layers will be invisible from other layers. These different analyses can be grouped into a single chart by selecting the global layer .
 |
|
Select the type of line to draw as indicated above.
-
For a horizontal or vertical line, click once in the chart to define the location of the line.
-
For an oblique line, click twice successively to define two points for this oblique line.
-
For two parallel lines, click three times successively to define these parallels.
To modify the position of a drawn line, select it with the mouse cursor and drag it within the chart while holding down the left mouse button.
To delete a line, select it with the mouse cursor and click with the right mouse button to open the context menu and then choose the option, or press the Del key on the keyboard.
Select the type of drawing:
-
click with the left mouse button at the starting point of the figure
-
then, depending on the type of figure, successively at the other points defining the figure.
-
Select an end of the figure or the entire figure by positioning the mouse cursor over its center. A square symbol appears at the selected end or all ends of the figure.
-
Press and hold the left mouse button while moving it.
-
When the end or the figure is in the desired location, release the left mouse button.
-
Select the figure by positioning the mouse cursor over it.
-
Click with the right mouse button to open the context menu and choose the option.
The copy is placed below the original and can subsequently be moved.
-
Select the figure by positioning the mouse cursor over it.
-
Click with the right mouse button to open the context menu and choose the option or press the Del key on the keyboard.
-
Select the figure by positioning the mouse cursor over it.
-
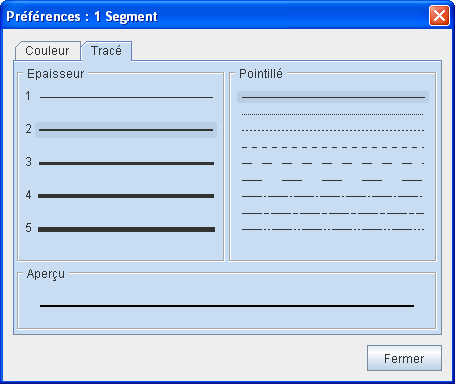
Click with the right mouse and button to open the context menu and choose the option to open the dialog window below. This window allows you to modify the color, thickness of the line, and the dotted line type.
For certain drawings, the user may wish to position an end exactly at the price of a high, low, closing, etc. price. To do this, Axial Finance has a magnet function that can be enabled (or disabled) from the menu of the chart window.
With the magnet enabled, drag the end of the drawing to a price close to the target price. Upon approach, a gray circle appears on that price to indicate its selection. Release the left mouse button. The end of the drawing then automatically positions itself on this price.
 |
|
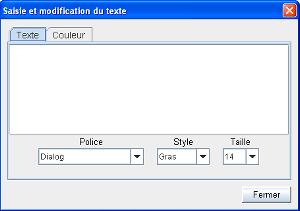
The first character of the text is positioned, depending on whether the context menu was opened by clicking with the left mouse button or if the menu option was selected from the top left of the main chart.
-
Select this text by placing the mouse cursor over the first character of the text. The entire text will be surrounded by a rectangle.
-
Press and hold the left mouse button while moving the text to the desired location.
Moving text within the main chart can only be done within that same chart, as can moving text within a secondary chart.
-
Select this text by placing the mouse cursor over the first character of the text. The entire text will be surrounded by a rectangle.
-
Either double-click on this first character or open the context menu (right-click) and choose the option to open the previous dialog window.
-
Then proceed as for entering a new text.
The procedure is identical for drawing each of these figures. These figures are based on a reference segment that is drawn in the same way as an ordinary segment after defining the figure type.
-
Select the type of figure to draw as indicated above.
-
Click with the left mouse button at the origin and then at the end of the reference segment.
To move or cancel a figure, the procedure is identical to that for an ordinary segment applied to the reference segment.
In the case of Fibonacci cycles, the reference segment is by principle the line segment located on the horizontal axis and connecting the first two vertical lines (the origin and line no. 1).
-
Locate the three pivot points of the fork on the chart.
-
Select the type of figure to draw as indicated above.
-
Click successively with the left mouse button at the location of the first, second, and third pivot points. The figure appears from the second pivot point and settles with the third pivot point.
To move or cancel a figure, the procedure is identical to that for an ordinary segment.
Axial Finance provides a library of many pre-programmed and fully customizable technical indicators.
These technical indicators are classified by nature:
-
Trend indicators
-
Momentum indicators
-
Volatility indicators
-
Volume indicators
-
Market indicators
-
Support-resistance indicators
and the button in the indicator selection window allows you to consult their explanatory sheet which:
-
indicates the nature of the indicator
-
provides its calculation method
-
presents a graphical example
-
specifies how to interpret it
Important
This documentation is also available on the Axial Finance website at the following address: https://www.axialfinance.com/en/produits/indicateurs.jsp.
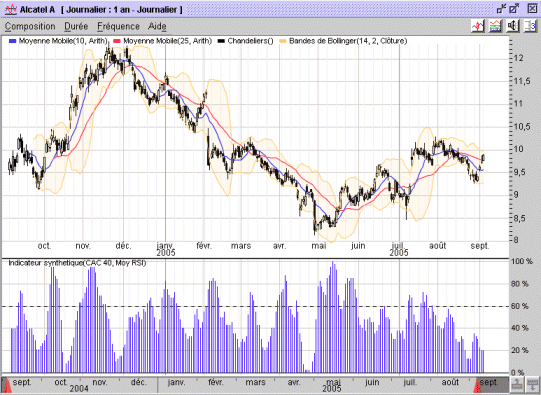
The synthetic indicator is designed to calculate, for a list of instruments, the percentage of those instruments that meet a screening rule or a signal.
Axial Finance allows you:
-
to choose a list of instruments relative to a market, an index, or a personal list
-
to choose a screening rule from the library
-
to display this synthetic indicator in a secondary chart
Note
To obtain a synthetic indicator based on one of the signals in the library, simply create a specific screening rule by including this signal under the AND condition.
To create and display a synthetic indicator:
-
If necessary, create and add the screening rule to be used in the synthetic indicator within the library (see the paragraph Creation and Editing of Screening Rules for the rule creation procedure).
-
Add the synthetic indicator to a secondary chart and then define its parameters.
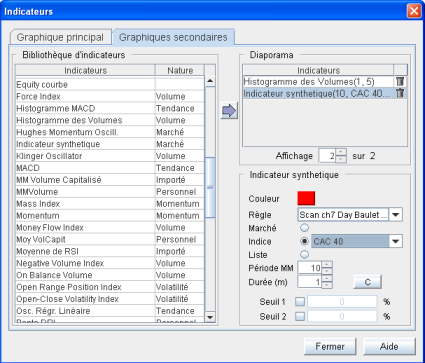
-
Select the from the dropdown list of the screening rule to be applied from the library
-
Define the list of instruments to be used in the calculation by selecting the corresponding option: or
-
Define the curve style for the indicator
-
Launch the calculation of the synthetic indicator by clicking on the button.
Consider the RSI with period pRSI and let us define a personal indicator
that calculates its moving average with period pMM.
Let us write the label of this personal indicator in the form
MMRSI(n, pRSI, pMM) where MMRSI is the code for this personal
indicator which therefore includes the three parameters n, pRSI
and pMM.
Let us then define the following signal:
MMRSI(0, pRSI, pMM1) > MMRSI(0, pRSI, pMM2)
with the following parameter values:
-
pRSI = 8 -
MM1 = 8 -
pMM2 = 12
The signal is therefore true when the first moving average MMRSI(0, pRSI, pMM1)
is greater than the second MMRSI(0, pRSI, pMM2).
The histogram chart of the s synthetic indicator provides for each period the percentage of instruments in the CAC 40 index for which the previous signal is true.