Chapter 3. Real-Time  |
||
|---|---|---|
| Prev | Next | |
Table of Contents
The real-time feed uses Internet streaming transmission to receive stock market transactions into the software at the very moment they are executed on the exchange.
Depending on the subscription(s) taken out, the feed transmits data relating to Stocks, Indices, Trackers, Futures, Commodities and Forex.
Upon subscribing to the real-time feed, the user receives a username and password which are automatically registered in the software.
Axial Finance uses this data feed to update in real-time:
and to detect real-time alerts defined by the user.
The real-time feed starts automatically upon opening the software, provided a valid subscription has been taken out. The feed status button located at the top right of the area then changes from red to green upon effective opening of the feed.
To interrupt the real-time feed, click on the status button, which will then turn red.
During the day, it may happen that the Internet connection interrupts the feed. In this case, click once on the feed status button while it is still green to turn it red, then a second time to turn it back to green.
The real-time feed transmits the following data for each instrument:
Instrument identification
Price, time and volume of each transaction
Cumulative volume exchanged since the session opening
Session opening price
Session high price
Session low price
Previous day's closing price
Price, time and volume of the best bid
Price, time and volume of the best ask
and additionally for Stock-type instruments, the order book:
Price of the 10 best asks
Number of orders for these 10 best asks
Volume of the 10 best asks
Price of the 10 best bids
Number of orders for these 10 best bids
Volume of the 10 best bids
Axial Finance has no limitation regarding the number of price charts that can be opened simultaneously with real-time data. Only computer capacity (CPU speed and RAM size) may encourage limiting their number to maintain acceptable graphical interface response performance.
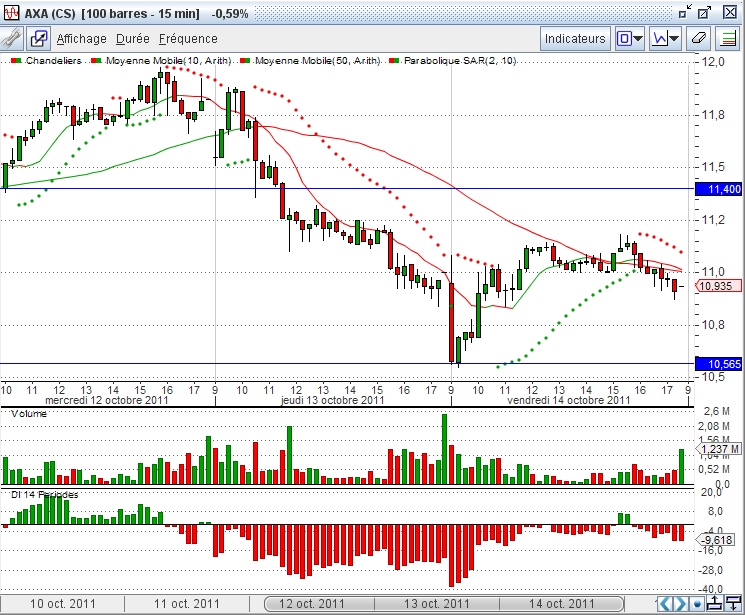
The and menus of the chart allow you to choose the number of prices displayed. Then, using the time slider and its associated buttons, you can adjust the useful duration (see chapter Chart Window).
In real-time, the chart is updated with each new transaction received and automatically shifts one position to the left with every creation of a new bar of the selected frequency. In the vertical scale, just below the last price, you can follow the time remaining in minutes and seconds until the closing of the current bar. To do this, activate this option in the menu, under , by checking the box .
This end-of-bar countdown activation option can also be activated in the general menu, under . It will then apply to all chart windows in the workspace.
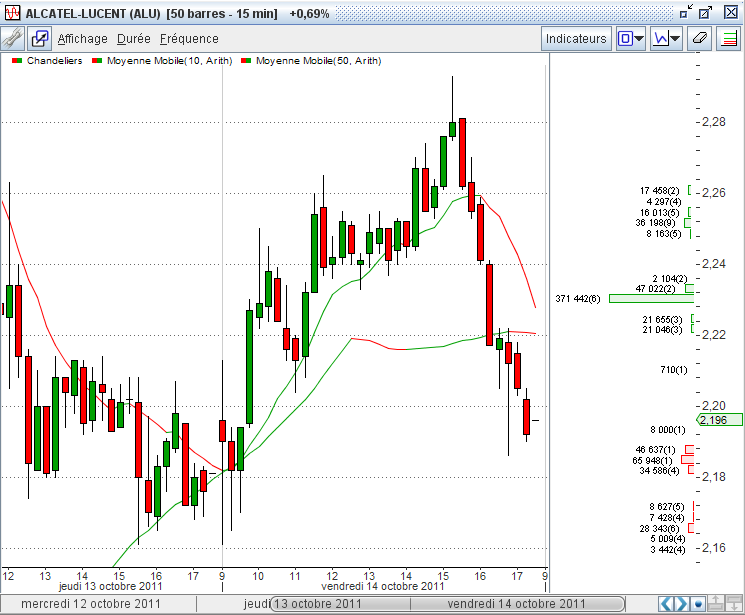
The order book for the instrument can be displayed directly within the chart by selecting the option from the menu. It is displayed in the form of horizontal histograms to the right of the prices, indicating the number of orders and the volume requested at each level of the book:
The Expert version allows opening two price tables simultaneously in the workspace, and the Maestro version allows an unlimited number.
Each price table displays, in several forms, the data transmitted via the real-time feed for the chosen list of instruments.
It is possible to choose to display instruments:
from an index of the selected exchange in the instrument list,
or from a personal list.
To open a price table, click on the button
 at the top and center of the
area, or use the general menu option .
at the top and center of the
area, or use the general menu option .
To close a price table, click on the cross in the upper right corner of the price table window.
To permanently save this opening or closing in the current workspace, you must save the workspace via the general menu .
The price table can be displayed in the area,
or in the case of multiple screens, in a window detached from this area to any location on these screens.
To detach or reattach the price table from the area, click on the button
![]() at the top left of its window.
at the top left of its window.
The information in the price table is displayed across three different pages selectable via a tab box located at the bottom of the table:
Page for monitoring the last transaction, the best bid, and the best ask
Page for specific monitoring of volumes during the session and particularly for detecting abnormal volumes
Page for monitoring the bid and ask before the market opens
The price table includes the following elements:
In its upper part, a toolbar containing:
The button ![]() to associate
the table with a group of windows. Any instrument selected in the table by a double click will be
assigned to the windows of this group.
to associate
the table with a group of windows. Any instrument selected in the table by a double click will be
assigned to the windows of this group.
The button ![]() to detach or reattach the window.
to detach or reattach the window.
A drop-down list to select the instrument list to display.
An menu to command the most frequently performed operations:

|
Opens a chart window for the instrument selected in the table |
|

|
Opens an order book window for the instrument selected in the table |
|

|
Opens the alert programming window for the instrument selected in the table |
|

|
Opens the instrument details page for the selected instrument in the table |
|

|
Opens the notepad for the selected instrument in the table |
|

|
Opens the management window for personal lists |
|

|
Duplicates the price table |
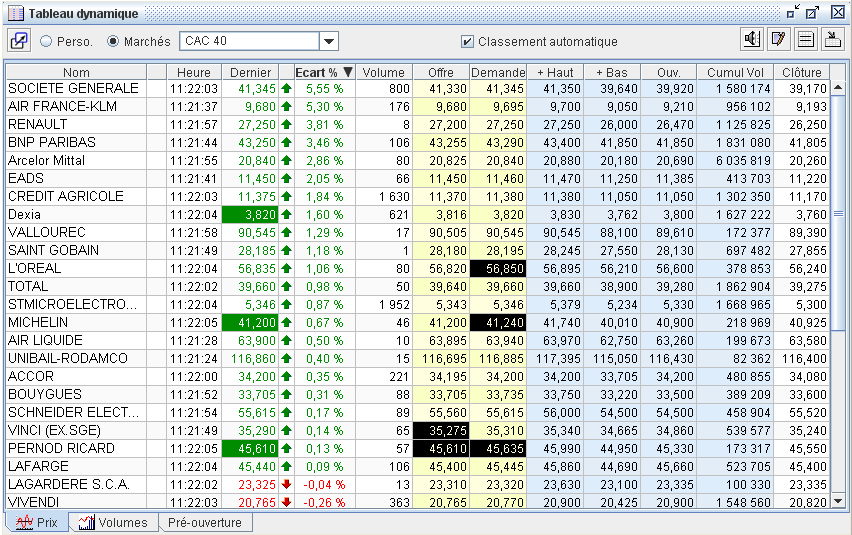
When the real-time feed is open, each time there is a change in the last price, cumulative volume, high price, low price, or bid/ask price, the video in the corresponding table cell will invert for a fraction of a second to attract attention.
Upon closing the feed, the data present at that moment is kept in memory until the next reopening.
In the column to the right of the last price, a vertical arrow colored green, black, or red characterizes the direction of the price change compared to the previous day's closing price, respectively representing an increase, no change, or a decrease.
By double-clicking on a row in the price table, the prices for that instrument will automatically be displayed in the selected chart window.
This page allows you to monitor the evolution of volumes during the session and to be immediately informed in case of unusual evolution (see the description in the following paragraph Volume Evolution Monitoring).
Click on the button in the price table
menu to open the management window for personal lists.
The procedure for managing personal lists is described in the paragraph Creation and Update of Personal Lists.
Tables can be configured to display only the desired columns. This column configuration is attached to the price table of a workspace and is therefore specific to this table.
Open the dialog window below by clicking on the button
 in the upper right corner of the table.
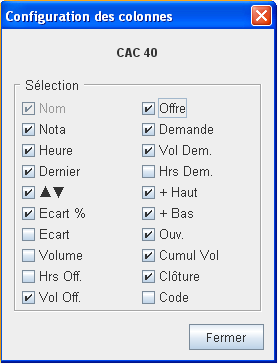
Check the names of the columns to display.
The positions of the displayed columns can be swapped in the table by selecting their header and dragging them horizontally. These positions are saved in memory.
Rows in the price table on the and pages can be automatically sorted in ascending or descending order by clicking on the column header that determines the data by which the sort is performed.
This sorting is automatic when the box is checked. In this case, with every arrival of new data in the real-time feed, the rows will be reordered. For example, if the Change % column has been selected for sorting, instruments will be systematically sorted by ascending or descending percentage change.
For each instrument on the page, a personal comment can be recorded in a notepad:
Select the row of the instrument in the table.
Right-click with the mouse to open the context menu and choose the
option, or click on the button.
A dialog window opens to record or modify a comment (maximum 2000 characters).
When a comment is present in the notepad, an icon appears to the right of the instrument name in the price table.
The tab of the price table displays the table below to graphically monitor the evolution of volumes exchanged during the session.
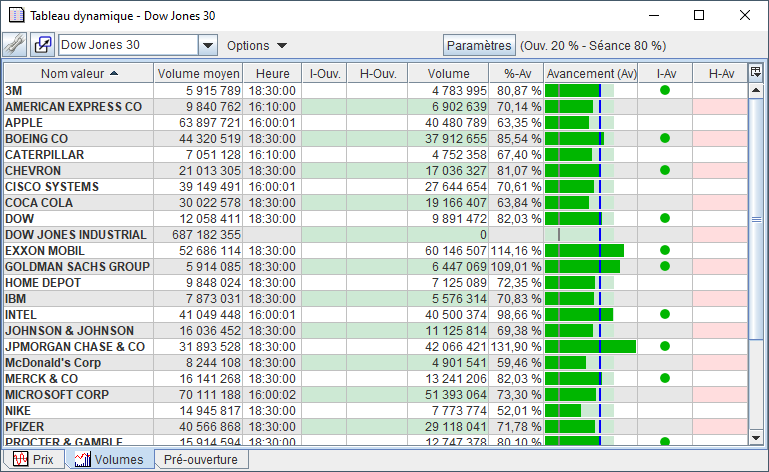
This table presents for each instrument:
The column indicates the reference volume calculated over the period defined by the user.
The column indicates the time of the last volume change during the session.
The column, where a green dot appears when an unusual volume is detected at the opening.
The column indicates at what time an unusual volume was detected at the opening.
The column indicates the cumulative session volume.
The column gives the percentage of cumulative volume compared to the reference volume.
The column shows the progress of the cumulative volume with the following information:
The light green background area indicates the reference volume.
The green bar shows the session's cumulative volume.
The vertical gray bar indicates the position of the level specified for the opening alert.
The vertical blue bar indicates the position of the level specified for the intraday alert.
The column, where a green dot appears when an unusual volume is detected during the session.
The column indicates at what time an unusual volume was detected during the session.
Axial Finance has a specific volume alert system to detect instruments whose traded volumes evolve unusually during the market session.
This system allows for the detection of two unusual evolutions:
At the opening of the session, when the volume of traded instruments exceeds a certain threshold.
During the session, when the cumulative daily volume exceeds a certain threshold.
This alert system uses the concept of reference volume, which is equal to the average daily volumes over a given period.
On the page, click on the button at the top of the price table to open the dialog window below:
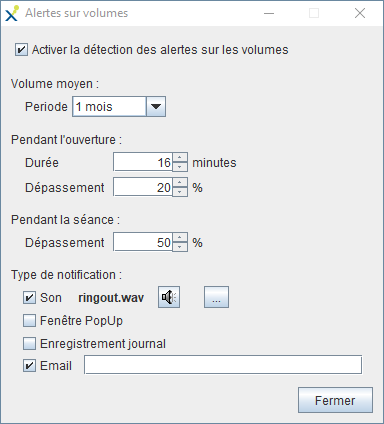
This window allows you to adjust the parameters for detecting volume alerts.
Activate alerts by checking .
Under , define the period over which the reference volume should be calculated. A drop-down list allows you to choose a specific duration.
Under , choose the duration in consecutive minutes following the market opening during which detection will be active. Then, define the threshold of excess from which the alert will be triggered.
For example, with a threshold of 20% and a reference volume of 1,200,000, the alert will be triggered if during the opening period the cumulative volume exceeds 240,000.
Under , define the threshold of excess from which the alert will be triggered during the session.
Finally, define the used when an exceedance is detected.
The order book allows you to consult the best bids and asks in real-time.
Axial Finance displays order books in three different forms:
In tabular form within an independent window
As a histogram chart in an independent window
Directly within the price chart (see paragraph Price Charts)
Axial Finance has no limit on the number of order books that can be opened simultaneously.
To open this type of order book, click on the button
![]() at the top and center of the
area, or use the general menu option .
at the top and center of the
area, or use the general menu option .
To close this book, click on the cross in the upper right corner of the window.
To permanently save this opening or closing in the current workspace, you must save the workspace via the general menu .
The book opens with the instrument selected in the instrument list. To change the instrument, select it with the mouse in the instrument list, then, while holding down the left mouse button, drag the pointer to the order book and release the button once you have arrived over it.
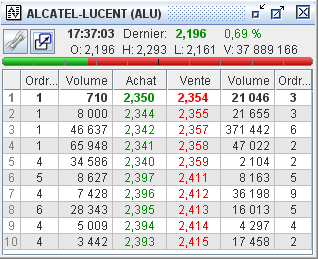 |
The order book displays the following information:
|
To open this type of order book, click on the button
 at the top and center of the
area, or use the general menu option .
at the top and center of the
area, or use the general menu option .
To close this book, click on the cross in the upper right corner of the window.
To permanently save this opening or closing in the current workspace, you must save the workspace via the general menu .
The book opens with the instrument selected in the instrument list. To change the instrument, select it with the mouse in the instrument list, then, while holding down the left mouse button, drag the pointer to the order book and release the button once you have arrived over it.
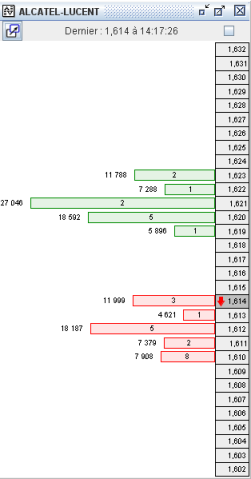 |
The order book is presented as a horizontal histogram. It displays:
|
Axial Finance has no limit on the number of transaction lists that can be opened simultaneously.
To open a transaction list, click on the button
 at the top and center of the area,
or use the general menu option .
at the top and center of the area,
or use the general menu option .
To close this list, click on the cross in the upper right corner of the window.
To permanently save this opening or closing in the current workspace, you must save the workspace via the general menu .
The list opens with the instrument selected in the instrument list. To change the instrument, select it with the mouse in the instrument list, then, while holding down the left mouse button, drag the pointer to the list and release the button once you have arrived over it.
Axial Finance displays all transactions executed on the exchange since the start of the session in a real-time table.
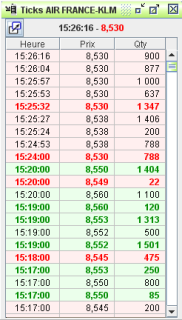 |
A color code allows you to identify the direction of trade evolution:
|
The Expert version allows opening two rankings simultaneously in the workspace, and the Maestro version allows an unlimited number.
To open a ranking, click on the button
 at the top and center of the
area, or use the general menu option .
at the top and center of the
area, or use the general menu option .
To close this list, click on the cross in the upper right corner of the window.
To permanently save this opening or closing in the current workspace, you must save the workspace via the general menu .
The choice of the instrument list is made from a list of international indices or one of the personal lists created by the user.
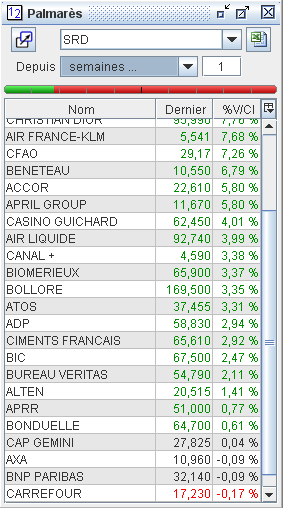 |
Each ranking allows you to have, in real-time, the ranking of a complete list of instruments over a chosen duration:
At the top of the ranking, a green/red graduated bar shows the % of instruments up or down. The ranking list indicates the last price and the percentage change over the chosen duration. By clicking on a column header, you can command the sorting of rows based on the data present in that column. |
The obtained ranking can be exported to Excel.
The Expert version allows opening one screener in the workspace, and the Maestro version allows an unlimited number.
To open a screener, click on the button
 at the top and center of the
area, or use the general menu option .
at the top and center of the
area, or use the general menu option .
To close this list, click on the cross in the upper right corner of the window.
To permanently save this opening or closing in the current workspace, you must save the workspace via the general menu .
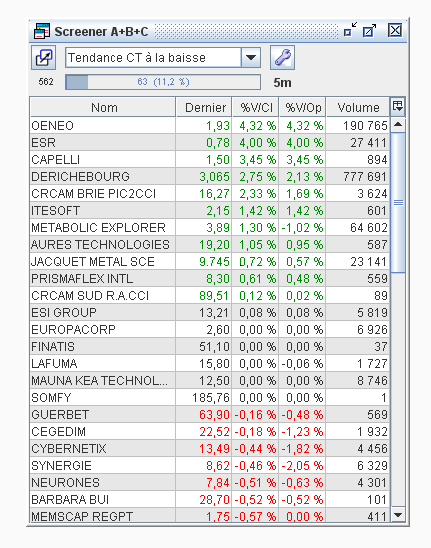
The screener searches in real-time, with each arrival of a new transaction, for instruments that meet a screening rule from a list and displays the result in a table. The chosen rule is one of the rules present in the software library: see chapter Creation and Editing of Screening Rules for how to define such a rule.
The choice of the instrument list is made from a list of international indices or one of the personal lists created by the user.
Screening is performed on prices with an intraday or "end-of-day" periodicity of your choice.
The result is displayed according to a ranking order based on price evolution or relative to the value of a technical indicator.
Click on the  button to open the configuration window below:
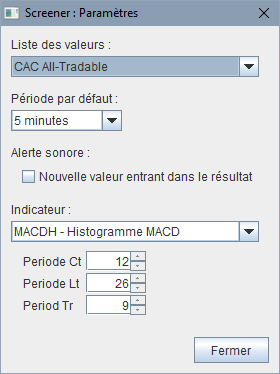 |
Choose the and the price periodicity from the drop-down lists. An audible alert can be activated to notify you when a new instrument validates the screener rule and enters the results list. It is possible to add an indicator that will be calculated in real-time for each result. This indicator can serve to sort the results according to a particular criterion. |
The screener determines in real-time, with each arrival of a new transaction, the instruments which, among the chosen list, meet the selected screening rule from the drop-down list. This drop-down list contains all rules present in the software library (see chapter Creation and Editing of Screening Rules).
 |
The columns of the results table can be configured by clicking on the button
Below the drop-down list for choosing the screening rule, a horizontal bar indicates the number of instruments contained in the selected list as well as the percentage of instruments found by the screener. The periodicity of the prices used for screening is indicated on the right of this bar. |
The Maestro version of Axial Finance includes the TickFlow module, which allows you to instantly view in a table all transactions exchanged for an entire list of instruments over a certain duration.
To open the TickFlow, click on the button
 at the top and center of the
area, or use the general menu option .
at the top and center of the
area, or use the general menu option .
The number of columns in the table depends on the window width. By increasing the width and height of the window, you increase the number of transactions that can be observed simultaneously.
Each transaction occupies a cell in the table, which is filled from left to right and from bottom to top as new transactions arrive. The four most recent transactions received are displayed on a yellow background with a black cell just below them to indicate the location of the next incoming transaction. When the last filled cell reaches the bottom right of the TickFlow table, it continues to fill the table by starting again at the top left and overwriting the previous transaction.
The dimension of the table as well as the quantity of transactions received determine the observation duration.
This table allows you to see instantly when a large number of transactions are executed on an instrument. In this case, that instrument occupies many cells. This observation signals significant movements in the instrument which will lead to a significant price variation.
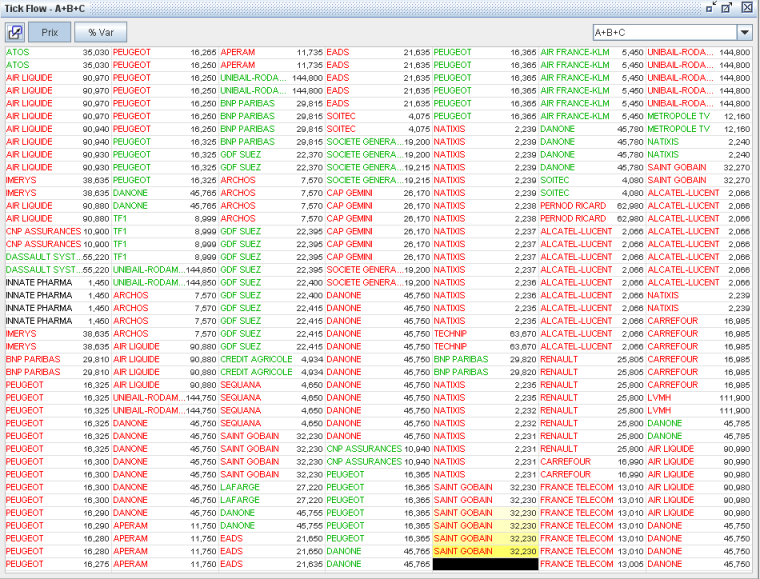
The name of the instruments is displayed in green, red, or black depending on whether the transaction price is up, down, or unchanged.
Two buttons and allow you to indicate next to the name the transaction price or its percentage variation compared to the last closing price from the previous day.
The selection of the instrument list is made via a drop-down list located at the top right of the window, which offers a choice from one of the personal lists created by the user.
Axial Finance has a centralized real-time alert system. Programming an alert can be done either from a chart window or from a price table. All alerts programmed for various instruments are viewable and modifiable in a table located in the screen under the tab.
Alerts can be triggered based on:
the evolution of prices and volumes
the crossing of resistances and supports
responses to signals from the software library
responses to rules from the software library
With each arrival of a transaction executed on the exchange, Axial Finance evaluates the programmed alerts and, if applicable, notifies you immediately.
There is no limit to the number of real-time alerts activated simultaneously.
An alert can be programmed:
either from a chart window by clicking the option in the menu of the window.
or from a price table by right-clicking on an instrument's row to open the context menu and then selecting the option.
In both cases, the following window opens and displays all alerts already programmed for that instrument.
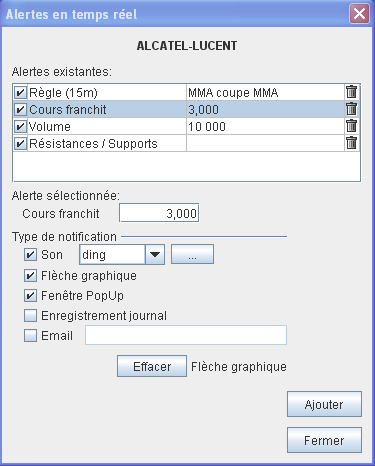 |
To delete a programmed alert, select it in the list and click on the
To view the conditions of a programmed alert or to modify them, select it in the list to display them just below. To deactivate a programmed alert without deleting it from the list, uncheck the corresponding box in the first column. |
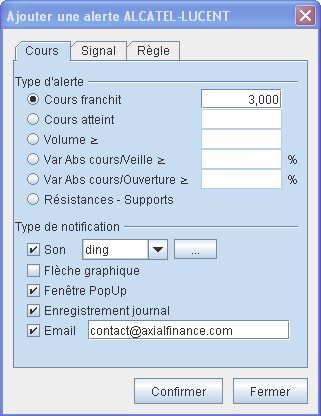
To add a new alert, click on the button to open the definition window below. This window contains three tabs: , , and , depending on the type of alert being programmed.
The tab allows you to choose between the following types:
 |
|
The or tab allows you to choose the signal or rule from the software library, the price periodicity to use, and at what time to consider detection within the bar.
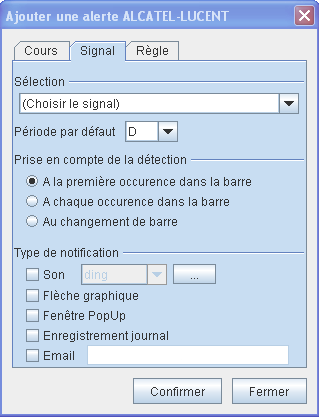 |
Choose the signal (or the rule) from the drop-down list. Choose the price periodicity from the drop-down list:
Choose the moment to take detection into account in the bar of the chosen periodicity: |
Each alert can be notified in 6 different ways by checking the corresponding box.
Through the emission of a sound chosen from a drop-down list. The list of sounds can be completed by the user by clicking on the button to the right of this list.
|
By opening a popup window, for example: |
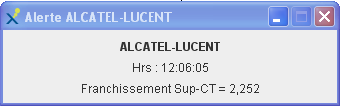 |
When multiple alerts are activated on many instruments with a high probability of occurring frequently, the number of popup windows opening can quickly become very large. It is advisable to remain cautious when using this notification mode.
A message is displayed for a few seconds in the system notification area before disappearing automatically.
When a price chart is open with the instrument being monitored, a vertical arrow appears at the last price with a label symbolizing the nature of the alert:
|
Pr |
when price is reached |
|
Pc |
when price is crossed |
|
V |
when volume is reached |
|
%C |
when the % change of price relative to yesterday is reached |
|
%O |
when the % change of price relative to opening is reached |
|
S |
when an alert triggers on a signal |
|
R |
when an alert triggers on a rule |
Example during the crossing of a support:
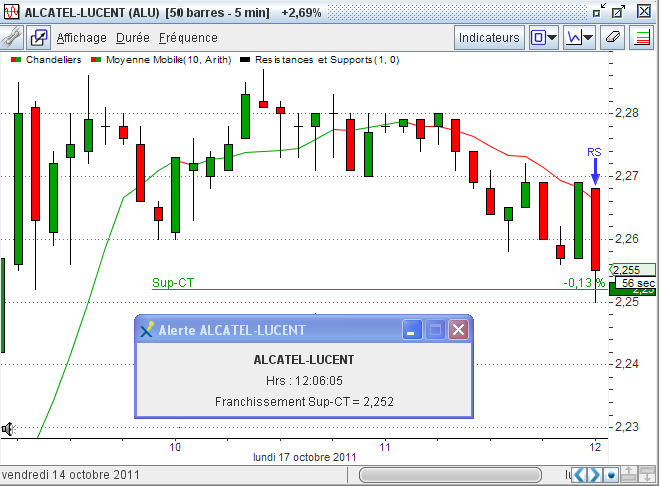
When at least one real-time alert is defined for the instrument in the chart, the
![]() icon
is present at the bottom left of the chart.
icon
is present at the bottom left of the chart.
When a or alert is activated for the instrument, a horizontal line indicates this price with the same icon at its left extremity.
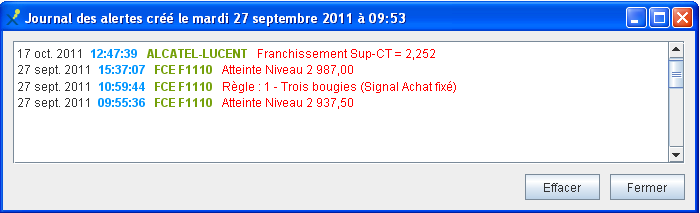
The alert journal is available in the general menu option .
Example of logging:
A specific email address can be defined for each alert. The last entered address is kept in memory and used for the alert notification unless it has been changed by the user.
When multiple alerts are activated on many instruments with a high probability of occurring frequently, the number of emails sent can quickly become very large. It is advisable to remain cautious when using this notification mode.
A centralized table for all real-time alerts is available in the screen under the tab. It indicates, for each instrument, the programmed alerts with the corresponding details.
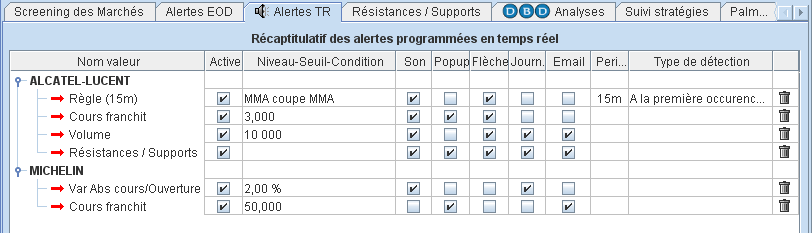
In this centralized table, you can modify, activate/deactivate alerts, and change the notification type
by checking or unchecking the corresponding boxes. To permanently delete an alert,
click on the  icon.
icon.
To modify other conditions of an alert, double-click its name in the first column to open the programming window.
Axial Finance allows exporting real-time feed data into Excel or any other application compatible with Microsoft DDE technology (Microsoft Dynamic Data Exchange), such as OpenOffice (Windows only).
This feature is provided by default with the software and requires no additional programs or external plugins. It starts automatically as soon as the software detects an open Excel sheet.
The Google Chrome browser may disrupt the DDE connection. We recommend closing Chrome before launching Axial Finance and Excel. Chrome can be restarted once the DDE link has been successfully established.
Display the list of instruments to be exported to Excel on the page.
Open an Excel sheet.
Select one or more cells from the price table to export to Excel and copy their content by simultaneously pressing Ctrl+C, or open the context menu and select the option .
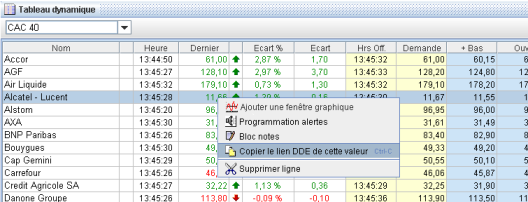
Then, copy each data cell from the price table into the Excel sheet by selecting the destination cell and right-clicking to open the context menu and choosing the option (or Ctrl+V).
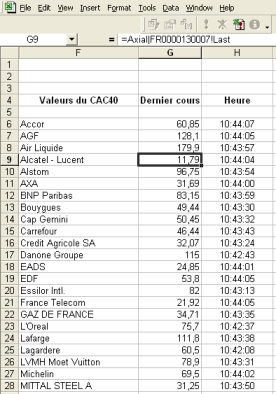 |
In the Excel cell, a formula of the following type is entered to define the data to import: =Axial|1_FR0000120321!Last This string consists of three parts:
The first and second parts are separated by the | character (vertical bar or "pipe"), and the second and third parts are separated by the ! character (exclamation mark). |
Alternatively, to steps iii and iv above, select a block of cells from the price table while holding down the Ctrl key and copy its content by simultaneously pressing Ctrl+C. Then, paste this block into Excel by pressing Ctrl+V.
Open the real-time feed: the data will then update in Excel.
Since the Excel sheet is open, when you stop and restart Axial Finance, you must reactivate the DDE link in the Excel sheet. To do this, double-click a cell in the Excel sheet containing data, then click on an empty cell in Excel. The link will automatically re-establish itself.
With Axial Finance open, when you reopen an Excel sheet already configured with DDE links, Excel will display a dialog box asking:
"The workbook you opened contains automatic links to information in another workbook. Do you want to update this workbook with changes made to the other workbook ?"
Click the button to accept the update.
Each piece of order book data can be exported to Excel (see the list below). To insert one of these data points into an Excel sheet:
Click in the Excel cell that is to receive the data.
In the Excel formula bar, type the following string of characters:
the = sign.
Axial.
the | character (vertical bar or "pipe").
the ISIN code of the instrument (12 characters) or the Axial code if the ISIN code is not defined.
the ! character (exclamation mark).
the data code (see the list below).
Example: =Axial|1_FR0000120321!Level1BidPrice
Press the Enter key.
|
Data Code |
Meaning |
|
|
|
|
Name |
Instrument name |
|
Isin |
ISIN code |
|
Symbol, Mnemo |
Mnemonic code |
|
Exchange |
Exchange |
|
Country |
Country code |
|
Currency |
Currency |
|
Id |
Axial Finance identifier for the instrument |
|
Last |
Last price |
|
Day |
Today's date |
|
Time |
Time of the last price |
|
Volume |
Volume of the last transaction |
|
CumulVolume |
Session cumulative volume |
|
MoneyFlow |
Cumulative session volume in capital |
|
Open |
Session opening price |
|
High |
Session high |
|
Low |
Session low |
|
Close |
Previous day's close |
|
Change |
The change relative to yesterday's close |
|
ChangePct |
Percentage change relative to yesterday's close |
|
PreOpenPrice |
Pre-opening price (Euronext stocks) |
|
PreOpenTime |
Pre-opening price time |
|
PreOpenPct |
% change of pre-opening price relative to yesterday's close |
|
OpenInterest |
Open Interest (futures contracts) |
|
Settlement |
Settlement price (futures, options) |
|
Expiry |
Expiration date (futures, options) |
|
|
|
|
BidPrice |
Best bid price |
|
BidVolume |
Best bid volume |
|
BidTime |
Best bid time |
|
AskPrice |
Best ask price |
|
AskVolume |
Best ask volume |
|
AskTime |
Best ask time |
|
|
|
|
LevelXBidPrice |
Price of bid level X (where character X = 1, or 2 ... for the rank of the level) |
|
LevelXBidVolume |
Volume of bid level X |
|
LevelXBidQty |
Number of bids at level X |
|
LevelXAskPrice |
Price of ask level X |
|
LevelXAskVolume |
Volume of ask level X |
|
LevelXAskQty |
Number of asks at level X |
|
|
|
|
Resistance1 |
Short-term resistance |
|
Resistance2 |
Medium-term resistance |
|
Resistance3 |
Long-term resistance |
|
Support1 |
Short-term support |
|
Support2 |
Medium-term support |
|
Support3 |
Long-term support |
