Table of Contents

In the general menu, select the tab.
The purpose of the functions grouped in the module is to provide users with several tools to assist in decision-making.
These tools allow for:
-
applied to "end of day" prices to search through a list of instruments for buy and sell signals derived from decision rules. Each rule consists of a set of conditions built from the technical indicators in the software's library.
-
Monitoring for end-of-day price alerts and for real-time, programmed alerts within the software.
-
The global table of levels for instruments to easily distinguish those near their levels.
-
, technical analyses updated daily and available in Axial Finance in real time as they are published.
-
to implement, day after day, the application of a strategy on a list of instruments and automatically obtain buy and sell orders, as well as order execution conditions and the evolution of the corresponding portfolio.
-
applied to "end of day" prices of instruments by market and over a given period, with instruments ranked by their increase, decrease, or proximity to the period's high or low.
-
Consulting the as a table for instruments as present in the software's database.
In the module, select the tab.
The purpose of screening is to search on a given date for all instruments in a market or a personal list that satisfy one or more screening rules. This screening function applies only to "end of day" prices. Axial Finance also allows for real-time screening (see the paragraph Screeners in the chapter regarding real time).
By definition, a screening rule is a set of conditions (see the paragraph Signals and Rules) based on technical indicators. Axial Finance also allows for easily designing such rules to perform screening.
After defining the screening rules and saving them to the library, they are assigned to a screening table to perform the search.
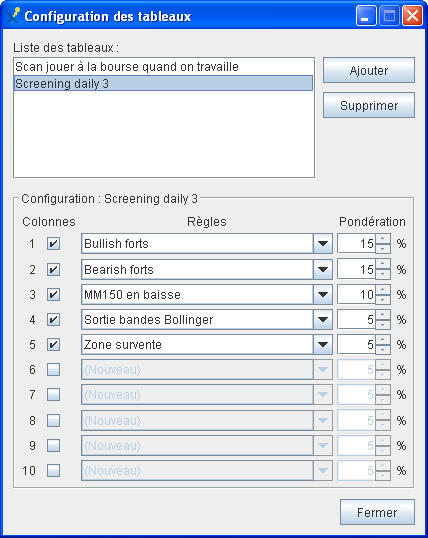
You can create as many screening tables as necessary, each screening table incorporating a maximum of ten rules. To create, modify, or cancel a screening table:
 |
|
 button at the top of the
 To perform a screening operation, define its parameters at the top of the screen:
-
Select the screening table from the dropdown.
-
Choose a list of instruments from the (the dropdown presents markets for the exchange selected in the instruments reference list) or a personal list by checking .
-
Choose the date for the screening.
-
Choose the "end of day" price frequency.
-
Launch the screening by clicking the button.
Important
On the screening date, Axial Finance checks if prices are present in memory and have sufficient history to perform the calculation of the indicators included in the rules. Otherwise, the screening report window will indicate Missing prices for (instrument name).
Interpretation of the result:
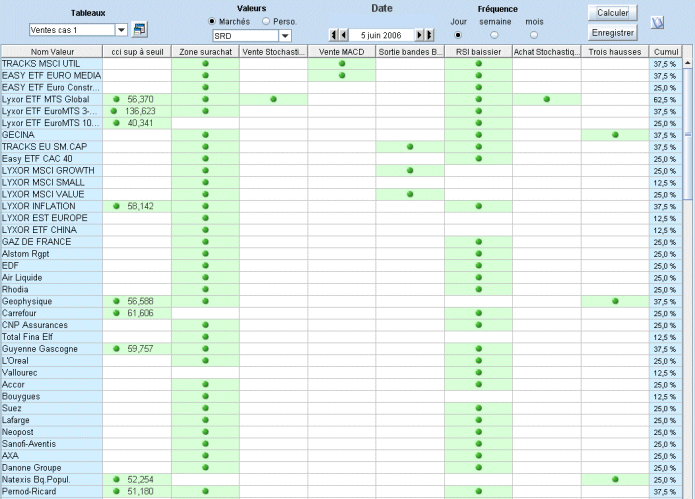
At the end of the calculation, the screening table displays instruments for which at least one of the rules gave a positive response, as well as in the last column on the right, the weighted cumulative result of the different rules to judge the relative importance of the result.
The table displays the result with a green dot
![]() and, depending on the case, with a numerical value
for rules consisting of a single signal based on comparison with a
numerical threshold, for example:
and, depending on the case, with a numerical value
for rules consisting of a single signal based on comparison with a
numerical threshold, for example:
-
12-day RSI greater than 70
-
10-day Trend (short term) is positive and greater than 0.5% per day
In the screening table, you can perform the following operations:
-
Click on a column header to sort instruments in ascending or descending order according to the result of a rule.
-
Double-click on an instrument name to automatically switch to the area and display its prices in a chart window.
-
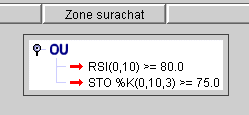
To consult the details of a rule in the screening table, right-click on the column header of the rule. A window shows the composition of this rule with its parameters:
To define the rules used in screening, Axial Finance provides a library of predefined and parameterizable signals.
To consult the list of available signals, in the general menu , choose the option . The rule editing window that opens displays the list of signals from the library on its right side.
Important
In principle, a signal is evaluated based on the prices of the chart's periodicity. For example, a signal used in a rule applied to a 15-minute chart will be evaluated with that same periodicity. This periodicity is called the default periodicity. Thus, in a rule, all signals will a priori be evaluated with the default periodicity.
The Maestro version allows working in . In this mode, each signal can be evaluated in its own periodicity set by the user. Thus, a rule could contain, for example, signals in 15-minute periodicity and others on a daily basis, regardless of the default periodicity.
Note
The following list is not exhaustive, as the library is updated as the software evolves.
|
Signals based on prices |
|
|
Signals based on volume |
|
|
Signals based on Simple Moving Average |
|
|
Signals based on Bollinger Bands |
|
|
Signals based on the Relative Strength Index |
|
|
Signals based on DMI |
|
|
Signals based on Momentum |
|
|
Signals based on MACD |
|
|
Signals based on Stochastics |
|
|
Signals based on Commodity Channel Index |
|
|
Signals based on Price Rate Of Change |
|
|
Signals based on Trend Ratio |
|
|
Signals based on Williams %R |
|
|
Signals based on Japanese Candlestick patterns |
|
|
Signals based on Resistance and Support levels |
|
|
Signals based on Fundamental Analysis ratios |
|
Each signal has one or more parameters originally defined with default values. When inserting a signal into a rule or testing the signal on a price chart, the precise parameter values are chosen.
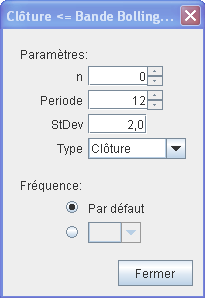 |
For example, this signal contains 4 parameters: , , and and additionally, in the case of the Maestro version, an extra parameter to define a if needed, which is different from the default periodicity. |
The parameter , which is always present in principle, serves to define the evaluation bar of the signal with the following convention:
-
0 for the current bar
-
1 for the previous bar
-
2 for two bars before the current bar
-
etc ...
The use of this parameter n allows for a time offset in number of bars of a signal relative to another.
A rule is defined as a logical combination (in the sense of Boolean logic) of signals which on a given date are in a TRUE or FALSE state.
Axial Finance is equipped with a graphical system allowing for very simple definition of even the most complex rules without requiring specific programming language knowledge.
A few simple examples of graphical representation of rules:
 |
 |
 |
||
|
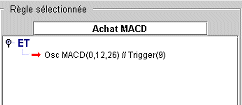
Rule composed of a single signal |
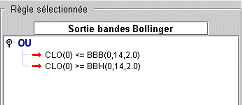
Rule composed of two signals where at least one must be TRUE (Boolean OR logic) |
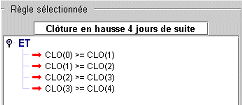
Rule composed of four signals which must all be TRUE (Boolean AND logic) |
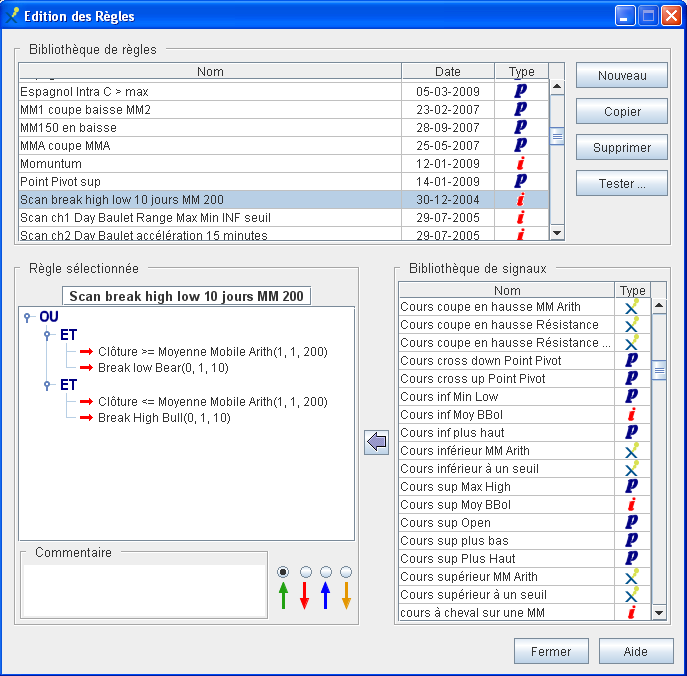
The rules are listed in a library which is accessed via the general menu , option .
The rule editing window presents:
-
in its upper part, the list of rules
-
on the right, the list of available signals
-
in the center, the frame contains the composition of the selected rule with its signals
To add a new rule to the library:
-
Click on the button. The frame then presents a blank area to enter the name of the rule and define it graphically.
-
Enter the name of the rule by replacing the default label "New".
-
Construct the rule graphically following the procedure described in the next paragraph.
To copy a rule, select it from the list and click on the button.
To cancel a rule, select it from the list and click on the button.
Each rule must start with an initial condition called the
root condition.
By default, this condition is an ![]() (AND in Boolean logic).
(AND in Boolean logic).
To replace the root condition AND with an OR, right-click on the
![]() icon of this
root condition to open the context menu, and choose the option
.
icon of this
root condition to open the context menu, and choose the option
.
Proceed inversely with .
To add a signal to the root condition or to any other
condition ![]() or
condition
or
condition ![]() of the rule:
of the rule:
-
Right-click on the condition icon, then open the context menu and choose the option . A red horizontal arrow
 prefiguring the place of the signal is inserted below.
-
Click on this red arrow to select it.
-
To then insert a signal from the library, two methods are available:
-
Select the signal from the list and click on the

-
or drag and drop the signal by pressing the left mouse button, dragging it while holding the button, and releasing it over the red arrow.
-
To replace a signal in the rule with another signal from the library:
-
Select the signal to be replaced by clicking on it in the graphical representation of the rule.
-
Then, two methods are available:
-
Select the new signal from the library and click on the
-
or drag and drop the signal by pressing the left mouse button, dragging it while holding the button, and dropping the pointer over the arrow in the graphical representation.
-
To delete a condition or a signal in the rule:
-
Click on the image of that condition or signal and then open the context menu by right-clicking it.
-
Choose the option .
Deleting a condition also deletes all signals and other conditions included in that condition.
Example of constructing a complex rule:
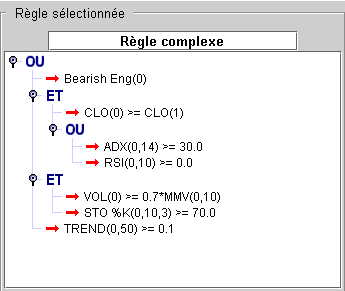
The signal placed in the rule is initially parameterized with its default values.
|
|
|

The Maestro version of Axial Finance allows for the operation of rules in multi-timeframes, that is, with signals determined at specific periodicities different from the default periodicity of the chart or the screener.
For each signal in the rule, the parameterization window above allows fixing a specific periodicity:
|
(x)m |
for (x) minutes |
|
(x)h |
for (x) hours |
|
D |
for daily |
|
W |
for weekly |
|
M |
for monthly |
When a specific periodicity has been fixed for a signal, this periodicity is written at the beginning of its parameter list as follows:
Example of the label for a 15-minute periodicity: Closing up(15m, 1, 2)
To verify the result of a rule in a price chart:
-
Select the rule from the rule editing library, verify that the parameterization of the signals is correct, and then click on the button.
-
Axial Finance displays the result of the rule in a chart window in the area (the window selected in case several windows are open). Each detection is marked by an arrow vertically aligned with the price. The color of the arrow is the one chosen in the rule editing window.
In the module, select the tab.
The allows for the real application of a trading strategy day after day and tracking the evolution of positions in the portfolio.
The following operations are performed:
-
Detection of position opening signals for the applied strategy
-
Analysis of these signals to decide on placing an order with the broker, providing price information for purchase, validity, and potentially the level of the trailing stop calculated by the software
-
Recording the opening of the position in the software portfolio when the order placed with the broker has been executed
-
Portfolio tracking: profits and performance
-
Detection of position closing signals
-
Analysis of these signals to decide on placing the order with the broker or knowing if a programmed stop has been executed by the broker
-
Recording the closing of the position in the software portfolio when it has been executed by the broker
The portfolio used is one of the portfolios from the module. If needed, creating a new portfolio must be done from this module.
The applied strategy is one of the strategies in the library (see the paragraph Creating Strategies).
To track a strategy, you must first define the parameters at the top of the screen:
-
Select the portfolio from the dropdown list.
-
Select the strategy from the dropdown. This list presents the various strategies present in the software's library.
-
Choose a list of instruments for which position opening signals will be searched, from the (the dropdown presents markets for the exchange selected in the instruments reference list) or a personal list by checking .
-
Choose the price type or and the of application for the strategy.
-
Choose the of the day and optionally the time. Axial Finance displays the current date by default. Use the left or right arrows to open the calendar.
Since prices are up to date in the software for the selected date, click on the button to launch the search for opening signals as well as the update of the portfolio status.
The screen displays the result of the opening signal search in its lower part:
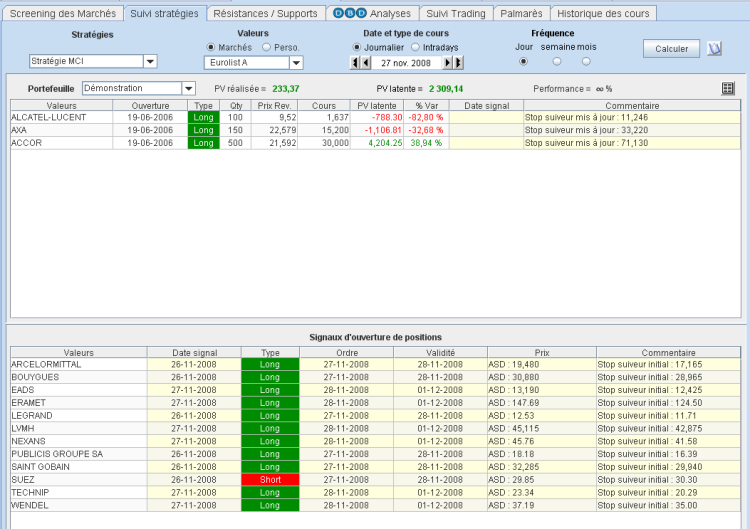
For each instrument presenting an opening signal on the selected date, Axial Finance indicates:
-
The date of the signal (or, if applicable, the date of the first signal when it repeats over several consecutive bars)
-
The nature of the order: Long or Short
-
The order date to be placed with the broker, taking into account the execution delay set in the strategy
-
The order validity period for execution defined in the strategy
-
The order price in the case of a market limit order or stop-loss trigger order
-
If applicable, the initial trailing stop level
Important
It is up to the user to decide which instruments from the list they will actually place an order for with the broker.
When an order placed with the broker is executed, the corresponding position is then opened in the software. To do this, double-click on the instrument line in the opening signals table to open the entry window. This window is identical to the one described in the paragraph Buy Orders of the chapter.
Once opened, the position is added to the upper part of .
For each open position, Axial Finance indicates:
-
The opening date of the position
-
The nature of the position: Long or Short
-
The quantity of shares
-
The average cost price
-
The last price
-
The unrealized profit/loss
-
The percentage gain or loss of the position
-
The date of the signal for closing calculated by the strategy
-
A comment which, in the case of a strategy with a trailing stop, specifies whether the previous level should be updated at the broker or remains unchanged
When the closing order placed with the broker is executed, the position is closed in the software by double-clicking on the portfolio line to open the entry window.
Above the list of positions in the portfolio, Axial Finance indicates the realized and unrealized profits as well as the performance since the creation of the portfolio.
The transaction journal can be opened directly by clicking on the
![]() button to the right
of the performance display.
button to the right
of the performance display.
Axial Finance allows up to three resistance levels and three support levels to be kept in memory for each instrument.
These levels can be used in several cases:
-
Display in price charts in the area
-
Display in the chart
-
Implementation of signals, rules, and strategies containing indicators based on these levels
In the module, under the tab, a table displays all the levels defined by the user for instruments in a market or a personal list.
The update of resistance and support levels can be performed from several parts of the software:
After selecting the exchange and market in the frame on the right to display a list of instruments, select an instrument from the table and enter the different levels into the frame.
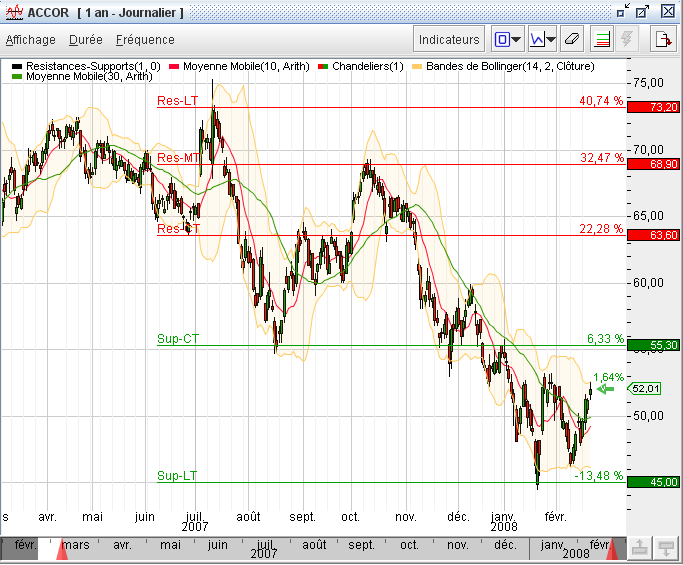
To display the levels in the chart:
-
Click on the function button
 of the chart window
or choose the
option from the menu.
of the chart window
or choose the
option from the menu.
-
Check the box in the dialog window.
-
Enter the levels into the , , , , , and fields.
To modify the price of a level, it is not necessary to reopen the entry window. Select this level with the mouse and drag vertically up or down while holding the left mouse button, then release the mouse button when the price displayed on the vertical scale is the desired one.
To facilitate level selection, when dragging vertically, the price varies according to a tick size determined as follows:
-
For a price < 2, the variation step is 0.01 (two decimals)
-
For a price >= 2 and < 100, the variation step is 0.1 (one decimal)
-
For a price >= 100 and < 1000, the variation step is 1
-
For a price >= 1000, the variation step is 10
To obtain continuous variation of the level regardless of the price magnitude, press the Esc key on the keyboard while dragging vertically.
To modify the style (thickness and dashed line) of the levels, click on the button
 of the chart window,
go to the tab, choose the indicator
Resistance-Support which is present in the
frame, and modify the and
parameters (the color of the levels cannot be changed).
of the chart window,
go to the tab, choose the indicator
Resistance-Support which is present in the
frame, and modify the and
parameters (the color of the levels cannot be changed).
For each level, Axial Finance displays the percentage deviation of this level relative to the last price.
See paragraph Entering and modifying Target, Resistance, and Support levels of the chapter.
In the Axial Finance indicator library, two preprogrammed indicators allow specifying a level of Resistance or Support:
-
Indicator LVLR(n, Rank) for a Resistance
-
Indicator LVLS(n, Rank) for a Support
where the parameter Rank takes one of three values: 1 (for CT), 2 (for MT), or 3 (for LT) to define the type of resistance or support.
Example: To define a Res-LT level, use the indicator LVLR(0, 3).
Four signals preprogrammed in the Axial Finance library can be used for insertion into a rule:
-
Signal Price near a Support with three parameters: n, Rank, and Threshold (as a percentage) defining the proximity of the closing price to the Support.
-
Signal Price near a Resistance with three parameters: n, Rank, and Threshold (as a percentage) defining the proximity of the closing price to the Resistance.
-
Signal Price crosses below a Support with two parameters: n and Rank.
-
Signal Price crosses above a Resistance with two parameters: n and Rank.
Note
The two indicators for levels LVLR and LVLS can be used to create custom signals in addition to those preprogrammed in the library.
Analyses performed by the Day By Day firm are available in real time in Axial Finance. These analyses cover the main European instruments and are updated daily. They are automatically transmitted to the software and can be consulted at any time.
Each analysis includes the following information:
-
The resistance and support levels.
-
Key chart patterns: channels, triangles, head and shoulders, gap, ...
-
Short-term and medium-term opinion
-
The target price and the invalidation level
-
The bullish and bearish reversal thresholds
-
The short-term forecast and the medium-term context
This data is presented partly in the price charts of the area, and partly in a global table in the module under the tab.
To display the analysis on the price chart, open the menu and select then .
By selecting in the menu, a window opens with the details of the analysis (see an example of this window in the following paragraph).
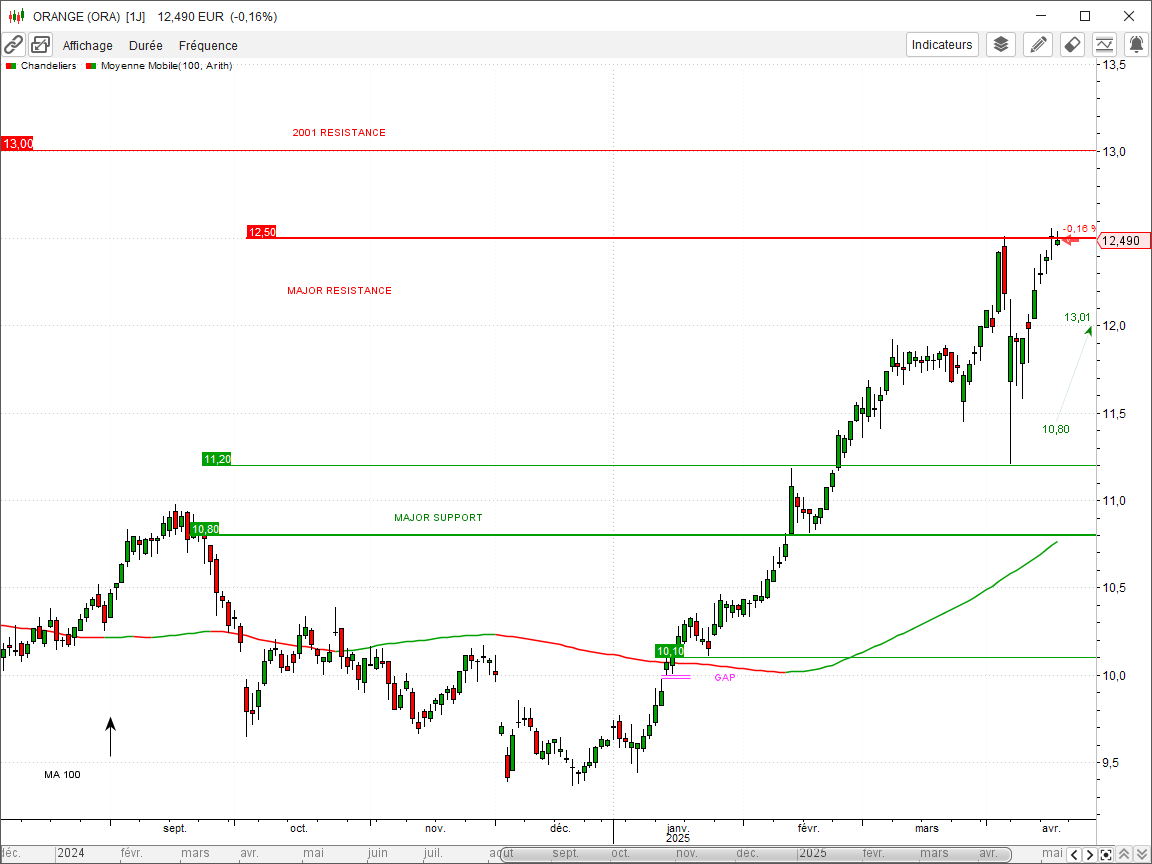
In the chart, the resistance and support levels, chart patterns, and comments from the Day By Day analysis cannot be modified by the user.
The resistance and support levels from the Day By Day analysis are represented differently from those defined by the user. The former have a small colored rectangle at their left end displaying the level's price.
Resistance and support levels considered major by Day By Day are drawn with a double line thickness.
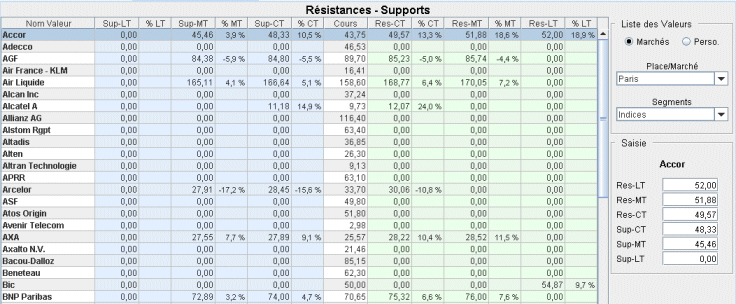
In , under the tab, a table presents all the resistance and support levels for available instruments for an exchange.
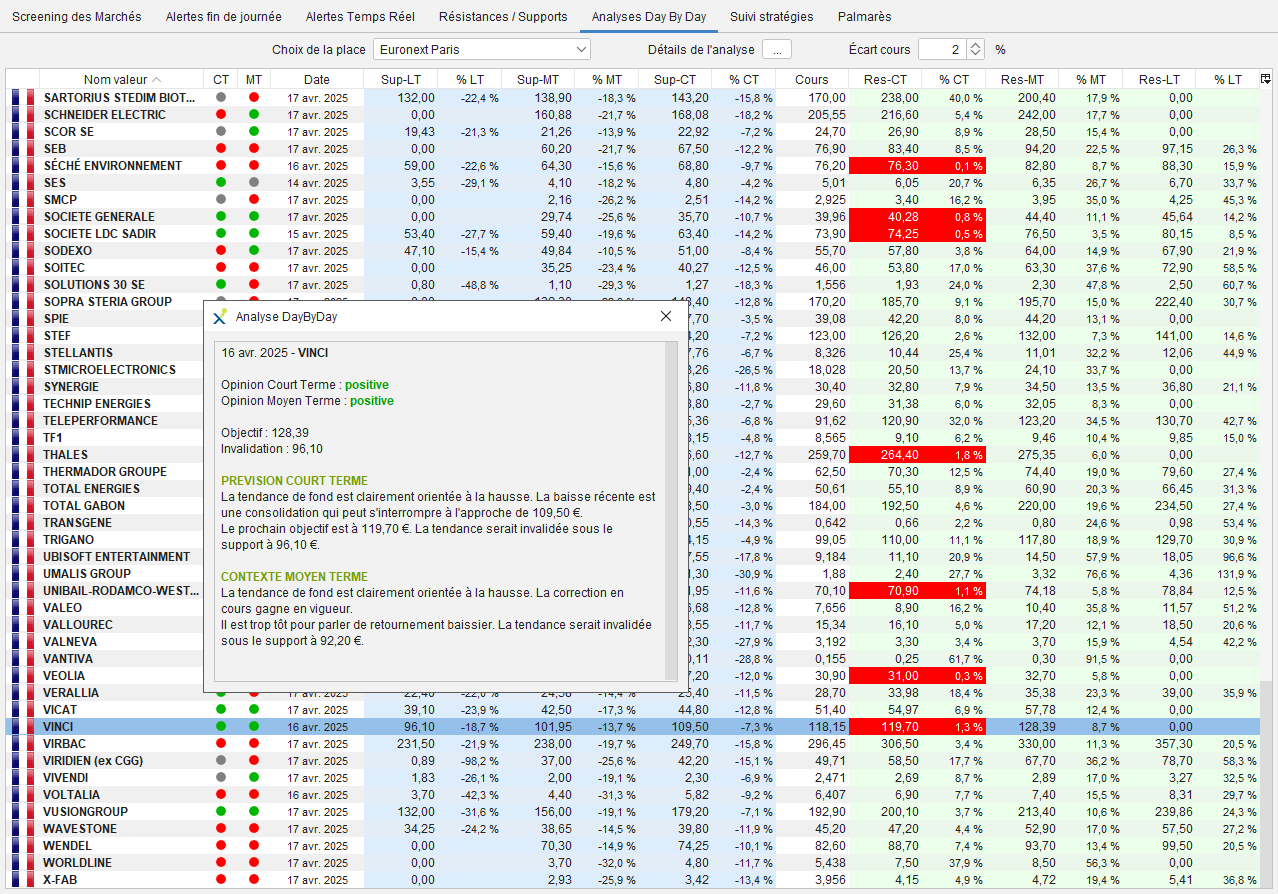
This table includes the following columns:
-
A flag reminding of the country of the instrument's exchange
-
The name of the instrument
-
Short-term opinion, summarized into three possibilities: positive (green dot), negative (red dot), or neutral (blue dot)
-
Medium-term opinion, summarized into three possibilities: positive (green dot), negative (red dot), or neutral (blue dot)
-
Support level 3 (or LT)
-
The percentage deviation of the previous level from the last price
-
Support level 2 (or MT)
-
The percentage deviation of the previous level from the last price
-
Support level 1 (or CT)
-
The percentage deviation of the previous level from the last price
-
The last known market price for the instrument
-
Resistance level 1 (or CT)
-
The percentage deviation of the previous level from the last price
-
Resistance level 2 (or MT)
-
The percentage deviation of the previous level from the last price
-
Resistance level 3 (or LT)
-
The percentage deviation of the previous level from the last price
By double-clicking on an instrument in the table, Axial Finance directly displays its chart in the area.
A percentage can be defined to identify levels whose deviation from the last price is less than that percentage. In this case, the corresponding cells in the table appear with a red background.
Axial Finance gathers in a single table the report of all alerts that can be programmed in the software for a list of instruments. These alerts are those detected on a given date relative to "end of day" prices. They concern:
-
the crossing of horizontal Resistance and Support levels defined by the user
-
the crossing of oblique Resistance and Supports drawn in price charts
-
entry into and exit from trend channels, rectangular and triangular zones drawn in price charts
-
the detection of a Signal
-
the detection of a Rule
Furthermore, this table also allows displaying the value of a technical indicator chosen from the software's library.
The alerts table is automatically updated after each update of "end of day" prices or after any change in the software regarding Resistance and Supports, trend channels, etc. ... as well as Signals and Rules in the library.
In the module, select the tab to display the alerts table.
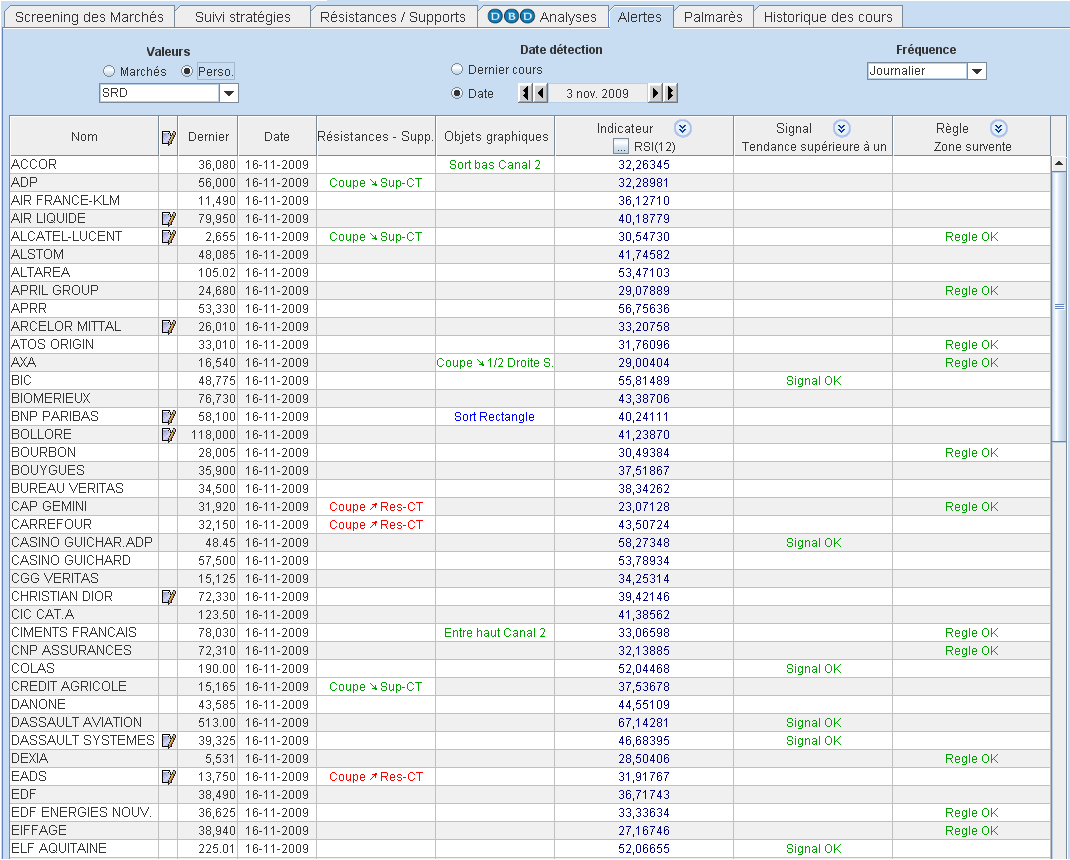
In its upper part, this table allows you to choose:
-
The list of instruments being tracked
-
The detection date for the alerts, which can be either the latest prices present in software memory or a date defined by the user
-
The "end of day" price frequency (Daily, Weekly, or Monthly)
It presents the following columns:
-
The name of the instrument
-
 to open the instrument's notepad
-
The last known price and its corresponding date
-
Alerts on horizontal Resistance and Support
-
Alerts on Graphic Objects
-
The value of an Indicator at the detection date
-
Alerts for a Signal
-
Alerts for a Rule
The horizontal Resistances and Supports used are those defined by the user in the price charts or in the screen of the module (see the previous paragraph Resistances and Supports).
In the table column, depending on whether a resistance was crossed upwards or a support downwards, one of the following labels is written:
-
Crosses ➚ RES-CT (or Res-MT or Res-LT)
-
Crosses ➘ Sup-CT (or Sup-MT or Sup-LT)
This crossing is relative to the price evolution between two dates: the date preceding the detection date and the detection date itself.
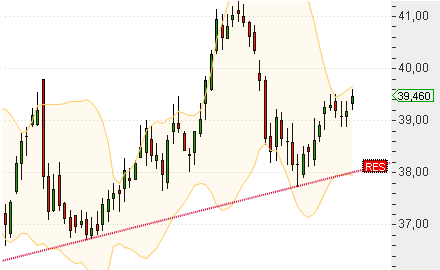
Axial Finance allows detecting alerts relative to the following tracings performed by the user in "end of day" price charts, also called Graphic Objects:
-
Horizontal line
-
Oblique straight line
-
Trend channel
-
Rectangle
-
Triangle
Once the Graphic Object is drawn, open its context menu by right-clicking on one of the reference points of the object, and choose as appropriate:
-
Activate RES alert or Activate SUP alert in the case of a horizontal or oblique straight line. This allows choosing between crossing a Support (SUP) downwards or crossing a Resistance (RES) upwards.
-
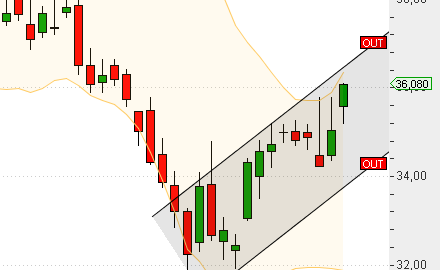
Activate IN alert or Activate OUT alert in the case of a Channel, Rectangle, or Triangle. This allows choosing between entering (IN) or exiting (OUT) one of these Graphic Objects.
Example of activated alerts:
 |
 |
To deactivate the alert, open its context menu by right-clicking on one of the reference points of the object, and choose the deactivation option present there.
In the Graphic Objects column, depending on whether an upward or downward crossing or entry/exit was detected, one of the following labels is written:
-
Crosses ➘ Horizontal or Crosses ➚ Horizontal
-
Crosses ➘ 1/2 Upper Line or Crosses ➚ 1/2 Lower Line
-
Exit low Channel, Enter low Channel, Exit high Channel, or Enter high Channel
-
Enter Rectangle or Exit Rectangle
-
Enter Triangle or Exit Triangle
The header of the column allows you to choose one of the signals from the library, which will be evaluated on the detection date. The parameters of the Signal are the default parameters.
Click on the button  to open the rule selection window and then click on the button
 to close it.
With each change, alerts are automatically recalculated and the label Signal OK is written in the column.
The header of the column allows you to choose one of the rules from the library, which will be evaluated on the detection date.
Click on the button
to open the rule selection window and then click on the button
to close it.
With each change, alerts are automatically recalculated and the label Rule OK is written in the column.
Axial Finance calculates the value of a technical indicator chosen from the software's library, calculated on the detection date. It is not alert information but complementary information to the alerts displayed in the other columns of the table.
For example, alongside a signal alert, it may be useful to know the value of an indicator such as the RSI or the MACD.
Click on the button to open the window for selecting the
indicator and its parameters and then click on the button
to close it.
With each change, the indicator is automatically recalculated.
Axial Finance allows you to save free text in a notepad (limited to 2000 characters per instrument).
Click on the icon in the column
of the instrument to open the notepad window.
The presence of the icon next to the instrument means that the notepad contains text.
Access to the notepad can also be done from the menu of the chart window for the instrument in the area.
This table centralizes all real-time alerts programmed in the software. See the paragraph real-time alerts in the chapter regarding real time.
In the module, select the tab.
For all instruments in a market or a personal list, Axial Finance determines the following rankings over a given period based on "end of day" prices:
-
The % change between the closing prices at the beginning and end of the period
-
The highest price reached
-
The % deviation between the highest price and the last price of the period (proximity to high extreme)
-
The lowest price reached
-
The % deviation between the lowest price and the last price of the period (proximity to low extreme)
Important
If prices for an instrument on the start or end dates are missing from the software's database, the corresponding cells in the rankings table remain empty.
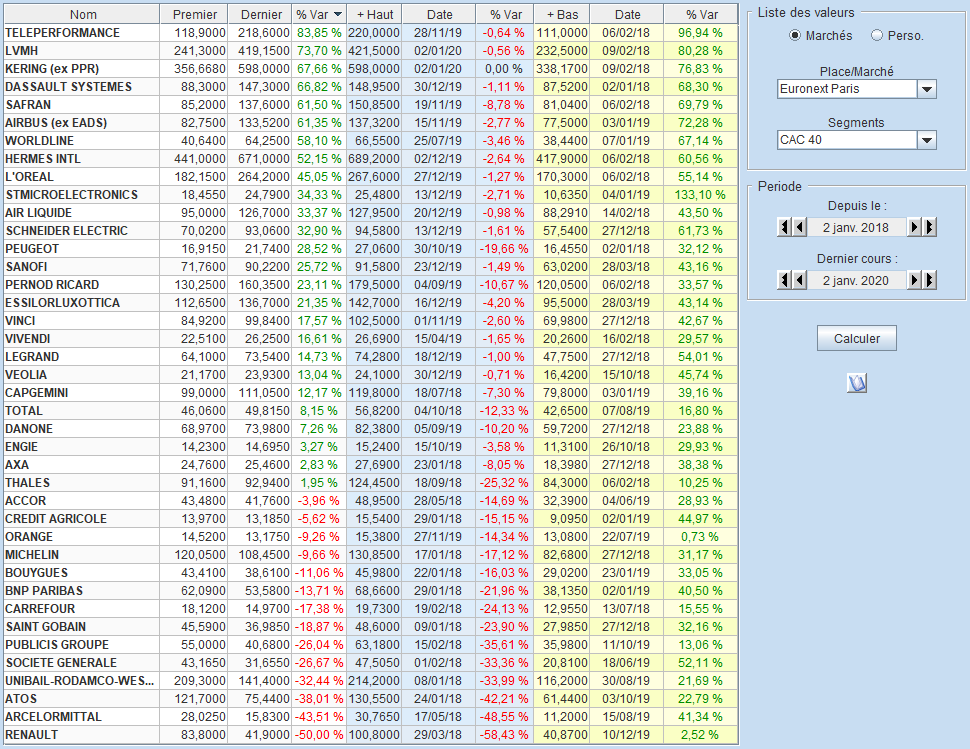
The table includes for each instrument:
-
The closing price of the first day of the selected period
-
The closing price of the last day of the selected period
-
The % change between this last price and the price of the first day (if the price does not exist on the start date of the ranking, the percentage change is not calculated)
-
The highest price reached during the period
-
The date of the highest price during the period
-
The % deviation between the last price and this high (this percentage is zero when the last price is equal to the period's high)
-
The lowest price during the period
-
The date of the lowest price during the period
-
The % deviation between the last price and this low (this percentage is zero when the last price is equal to the period's low)
On the right of the rankings table, the parameter selection area:
-
In the frame, choose between or for a personal list, then, depending on the case, one of the markets for an exchange or one of the personal lists.
-
In the frame, define the start and end dates of the ranking.
After calculation, instruments are ranked by descending performance. It is possible to click on the column headers to obtain a different sorting. For example, sorting by the column showing the deviation from the high price allows identifying instruments close to their high extreme during the period considered.