
Technical Indicators
Fibonacci Fans
Refer to the Fibonacci Retracement page.
Calculation Method and Interpretation
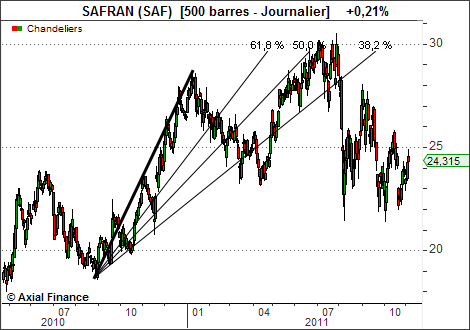
Identify on the price chart a period corresponding to a significant trend cycle and draw a line connecting the highest high and lowest low (or vice versa) of that period.
The distance between these two points serves as the basis for Fibonacci levels. Typically, three
levels are displayed corresponding to distances of 38.2%, 50%, and 61.8% of this distance.
Three lines are drawn from the starting point of the previous trend with slopes such that these
lines intersect the previous distance at the three percentages.
Shortly after a major trend reversal, "Fibonacci Fans" define support and resistance lines, and price targets for the anticipated correction.
Example