Technical Indicators
Fibonacci Retracement
Fibonacci, a mathematician from the early 13th century, discovered a mathematical sequence of numbers that plays
a key role in the cyclical evolution of phenomena in general.
The Fibonacci sequence is calculated as follows:
U(n) = U(n-1) + U(n-2)
Thus, the first numbers are: 1, 1, 2, 3, 5, 8, 13, 21, 34, 55, 89, 144, 233, etc.
This sequence has remarkable properties:
- As n approaches infinity, the ratio of two consecutive numbers approaches 1.618, which is the golden ratio of mathematics, or 0.618, its inverse, the golden ratio.
- The inverse of the golden ratio is the golden ratio; their difference is 1.
- As n approaches infinity, the ratio U(n)/U(n-2) approaches 2.618 or its inverse 0.382
Forecasts based on the Fibonacci Retracement method assume that instruments evolve cyclically according to the rhythm of the golden ratio.
Calculation Method and Interpretation
Fibonacci Retracement are complementary to Fibonacci Extensions. In the case of Retracement, the levels considered range from 0 to 100%. With Extensions, the levels considered are greater than 100%.
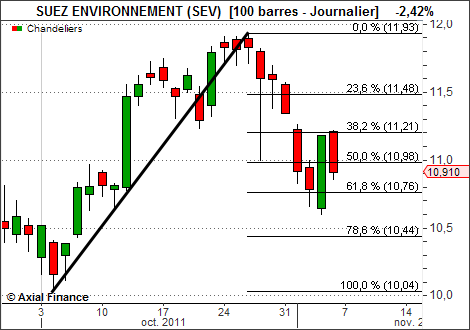
We identify on the price chart a period corresponding to a significant trend cycle and draw a line connecting the highest and lowest (or vice versa) points of that period.
The distance between these two points serves as the basis for Fibonacci levels. Generally, five levels
are identified corresponding to distances of 100%, 127.2%, 161.8%, 200%, and 261.8% of this distance from the end point
of the identified trend.
Horizontal lines are drawn for each level, acting as support and resistance lines.
Immediately after a major trend change, "Fibonacci Retracement" defines price correction objectives of significant magnitude.
Example