The Accumulation Distribution Index (or A/D) is an indicator that combines price changes with
volume. This indicator is based on the fact that the more volume accompanies price movement, the more
significant that movement is.
The Accumulation Distribution Index is a variant of the On Balance Volume, but
the A/D appears to be less effective than the On Balance Volume.
The difference with the A/D is that daily volumes are weighted by the closing price position relative to
the extreme daily range ("range").
This indicator developed by Marc Chaikin is the basis of the Chaikin Oscillator.
Calculation Method
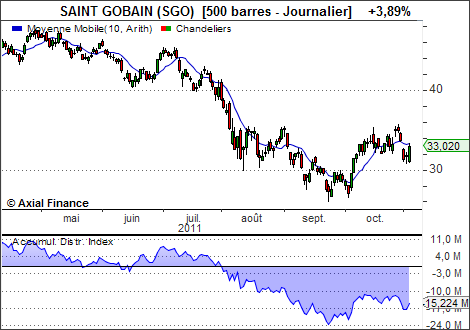
Example
Interpretation
When A/D rises, it indicates that the security is in an accumulation phase because most volumes are associated
with price growth.
When it declines, it indicates that the security is in a distribution phase because most volumes are
associated with price decline.
A divergence between the Accumulation/Distribution and the security price means that a change is imminent.
When a divergence occurs, the price usually reverses to confirm the A/D.