
Technical Indicators
On Balance Volume
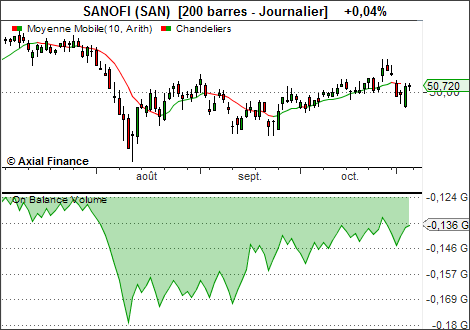
The On Balance Volume (or OBV) indicator uses volume to assess market strength by calculating the ratio between volume and price changes. It was designed by Joseph E. Granville in 1976.
If the closing price is higher than the previous day's, the volume traded that day is added. Conversely, if the closing price is lower than the previous day's, the volume traded is subtracted.
Calculation Method
If C > CP thenOBV = OBVP + V
If C < CP then
OBV = OBVP - V
If C = CP then
OBV = OBVP
where:
- OBVP: Previous day's OBV
- V: Today's volume
- C: Today's closing price
- CP: Previous day's closing price
Example
Interpretation
- Generally, it is assumed that OBV varies before prices.
- When investors flock to a stock, its OBV increases along with the price.
- If the price movement precedes that of the OBV, a non-confirmation occurs. Non-confirmations occur when the market is at its extremes.
- OBV is rising when each new high is higher than the previous one and each new low is higher than the previous low.
- Conversely, OBV is falling when each new high is lower than the previous high and each new low is lower than the previous low.
- When OBV fluctuates successively up and down, the trend is uncertain.
- When a trend is established, it continues until it is broken by an opposing trend or an uncertain trend.
- If an uptrend is broken by a short-lived uncertain trend, the uncertain trend can be ignored.