Standard deviation is a statistical measure of the volatility of an instrument relative to its
Arithmetic Moving Average (of period P) and therefore allows characterizing
the dispersion of prices.
Usually, the Standard Deviation is used as an element of another indicator rather than alone. For example,
Bollinger Bands are calculated by adding the standard deviation to the moving average.
Calculation Method
where:
P: The period
Avg: The average price over the period
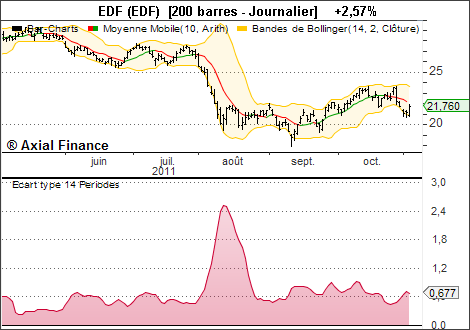
Example
Interpretation
The standard deviation reaches a high level when prices vary significantly. Conversely, it remains low when prices
are relatively stable.
Many analysts believe that major price peaks are accompanied by high volatility because investors are driven
by euphoria or fear. Major troughs are calmer because investors have little hope of profit.