
Indicateurs techniques
Bollinger Bands
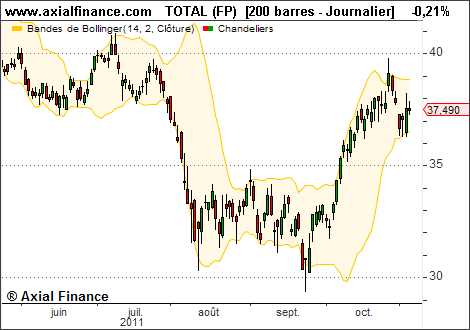
Bollinger Bands were developed by John A. Bollinger. They signal oversold and overbought levels by representing two bands equidistant from the moving average of prices.
Bollinger Bands are calculated from the moving average of the security, to which one adds and subtracts two times the standard deviation. These bands therefore measure the volatility of prices relative to a moving average.
John A. Bollinger recommends using:
- for short-term cycles, a 10-day moving average with a standard deviation of plus or minus 1.5.
- for medium-term cycles, a 20-day moving average with a standard deviation of plus or minus 2.
- for long-term cycles, a 50-day moving average with a standard deviation of plus or minus 2.5.
Example
Interpretation
Relative to the moving average, Bollinger Bands widen during periods of volatility and narrow during calmer periods.
John A. Bollinger identified the following characteristics of his indicator:
- Prices tend to move sharply after a band contraction.
- If prices break out of one of the bands, the trend is expected to persist.
- If prices reach peaks or troughs outside the bands, then reach peaks or troughs inside the bands, this may suggest a trend reversal.
- A movement (a trend) that starts on one band always tends to extend to the opposite band. This allows price projections.