
Axial Finance Premier
Analyze and follow market trends on graphical charts
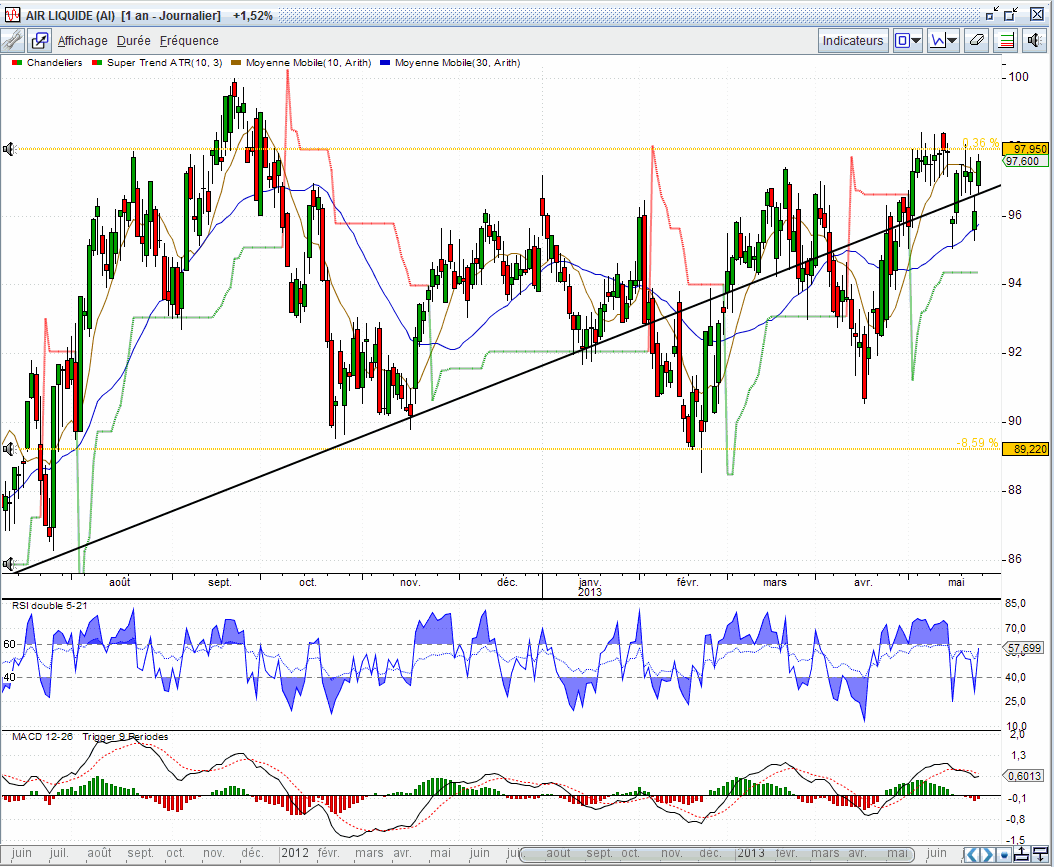
The easiness to use graphical charts and their quality of presentation allow to clearly and precisely analyze market trends in the short, medium and long term.
The graphical charts, which can be opened simultaneously with no number limit, provide
the ability to easily compare stocks together and to retain those whose potential is more promising.
The identification of chart patterns and levels of support and resistance
on the time horizon studied show the times of the most profitable decisions.
The results of the graphical analysis are automatically registered in memory
and made available for recall with each stock.
Many drawing tools are available to easily get the levels of Fibonacci, Gann,
Speed Line and Andrews forks.

Use the most relevant customizable technical indicators for your analysis
Technical indicators are the basis of technical analysis, they show and highlight the past and foreseeable market trends.
Axial Finance offers a wide range of customizable indicators (more than 60) that
can be very easily added into graphical charts, either in the upper part of the chart
(together with the price curve) or just below.
In the lower part of the chart, up to 5 indicators called "secondary indicators" can be
displayed simultaneously from a wide selection. A device called slideshow
allows to move vertically these indicators in a mouse clic.
For each indicator the style is customizable : color, thickness, dotted line and curve shape.
In addition, for some indicators like the Moving Average, the drawing can be
done with two colors, green or red depending if the curve is going up or down.

Get a detailed list of winner/loser stocks for a whole market
Based on daily prices, the search of stocks among a market which, from a defined date, are the most winning or loosing or near their highest or lowest prices, is simple and fast to obtain.
The search can also be performed on a list of stocks created by the user and mixing stocks of different exchanges. Such lists have no limit in the number of stocks.
The overall result is displayed in a detailed table showing the percentage change since the start date and also with respect to the historical highest and lowest prices.
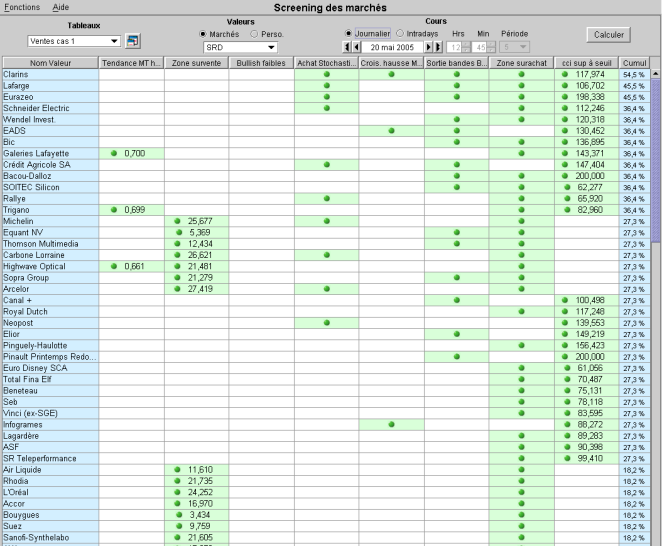
Automatically screen and get all stocks complying with your criteria
From a list of hundreds or thousands of stocks, the search for those stocks that meet simple or complex decision criteria is a very important possibility for a trader.
Axial Finance offers an easy solution to quickly obtain the expected result.
Simply select:
- The decision rules to apply from the software library. This library contains many rules that come with the software, and users can add their own rules.
- A list of stocks of a market or a list of stocks created by the user
- The date of the research. This research can be conducted for a date in the past, allowing you to test and validate the rules applied.
The search result is obtained immediately, typically within a few seconds for a list of several thousand stocks.

Manage and follow the performance of your portfolios
Axial Finance manages any number of portfolios including stocks or other instruments,
and instantly displays their current value, the potential and realized profits, and the available cash.
The positions of a portfolio can be recorded in a specific currency (e.g. USD),
and the profit automatically calculated in the reference currency chosen (e.g. EUR)
with the current exchange rate.
Each open position shows the detailed status: number of shares, current value, average cost, and unrealized and realized profits.
The order book can trace the entire history of executed orders and specifically shows the total sales and profits realized over a chosen period.
Performance is calculated from the portfolio's creation or an interim date. The relevant performance graph shows the evolution of the invested money in percentage and compares this evolution to that of a market index.
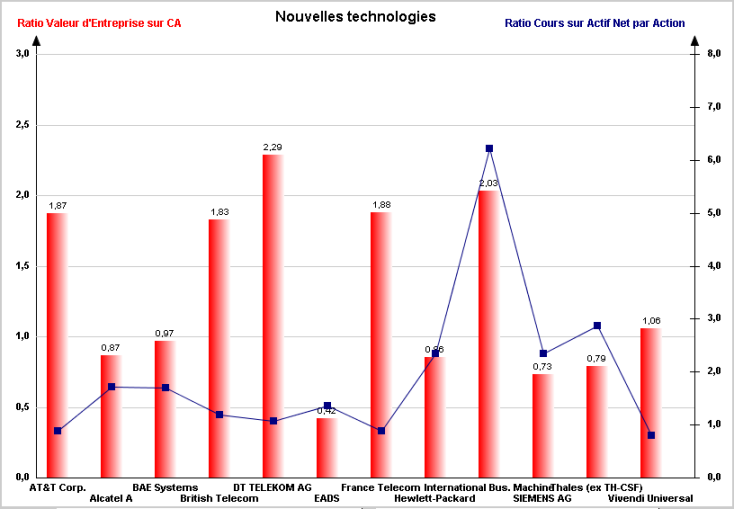
Improve the technical analysis with the fundamental analysis
Fundamental analysis is a very useful complement to technical analysis for investors
over the medium and long term.
Data of companies for fundamental analysis are available on the Internet and entered
and stored in Axial Finance, then exploited in several ways:
- For each company over several years to analyze the evolution of their operating accounts.
- To calculate key financial ratios.
- To compare all companies based on their financial ratios.
- To search among companies in the same economic sector for those with the best prospects for profitability.
- To create dedicated indicators for fundamental analysis, which can be combined with technical analysis indicators to provide a global analysis.