
Axial Finance Expert

A Trading room at your disposal
The workspace is fully configurable and can include the following windows spread over one or more screens depending on the hardware configuration of the computer :
- An unlimited number of Easy-To-Use Live Charts working on a tick by tick basis
- Two Watch Lists, each with a maximum of 1500 stocks (equities, futures, indices, Forex, ...) with auto-sorting capability on the chosen column.
- A real-time Market Screener with a maximum of 1500 stocks, to detect every seconds thoses stocks meeting the user's selection criteria.
- Two real-time Winner/Loser Rankers, each with a maximum of 1500 stocks. The Winner/Loser Ranker classifies every seconds the listed stocks according to their price variations over a selected period of times in minutes, hours, days, weeks or months.
- An unlimited number of Trade Order Books (Level 2)
- An unlimited number of Lists of Trades from the day opening
The number of workspaces has no limit, each saved under a chosen name and easily recalled.
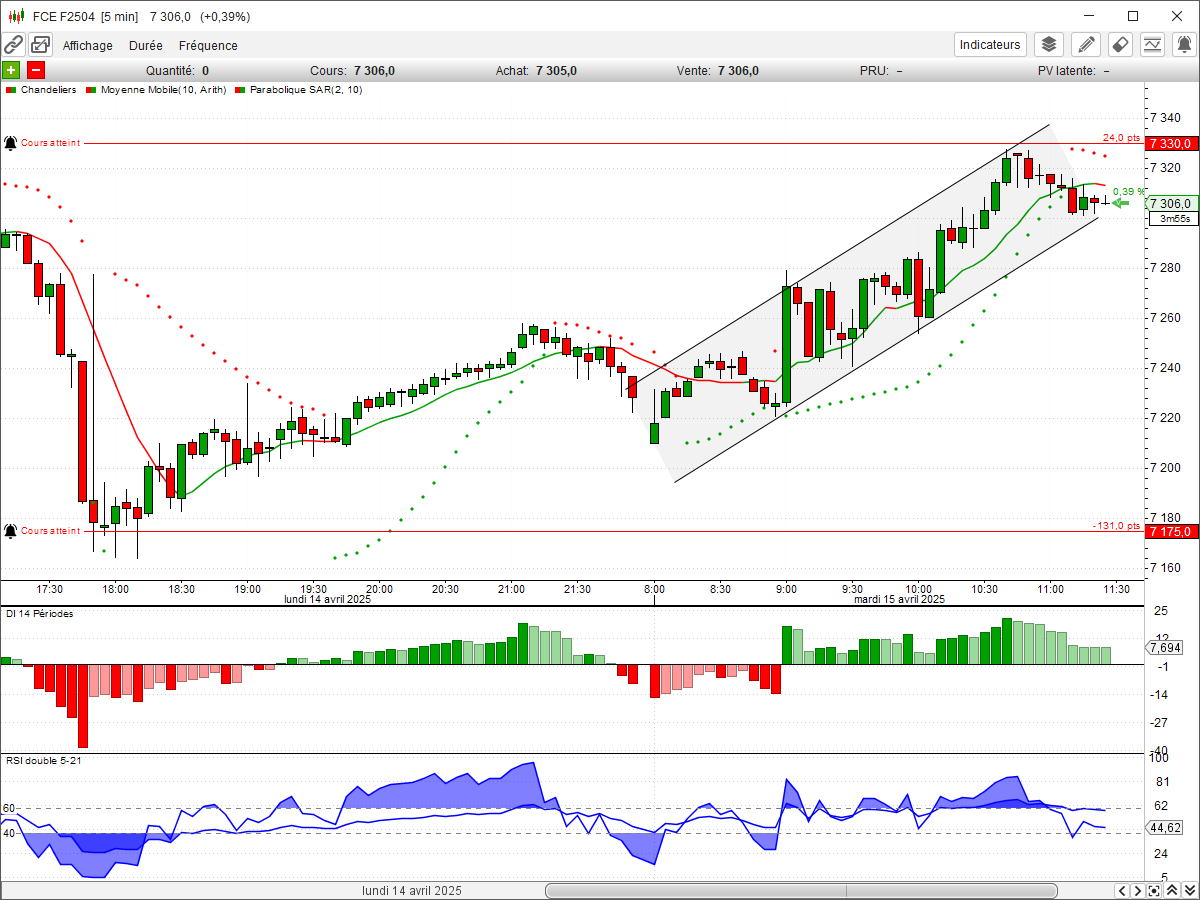
Follow in real-time the evolution of prices in Live Charts and Watch Lists
Real-time data are sent on Internet in streaming ("push") at the precise time trades are executed by the stock exchanges ("tick by tick") or when the order book is updated.
Real-time data are processed in the different modules of Axial Finance : Live Charts, Watch Lists, real-time Screeners, real-time Winner/Loser Scanners, Trade Order Books, Lists of Trades, real-time Alert Detector, Trading Portfolios, ...
According to real-time subscriptions, the stream delivers relevant data for equities, indices, ETF's, Futures, Options, Warrants, Commodities and FOREX.
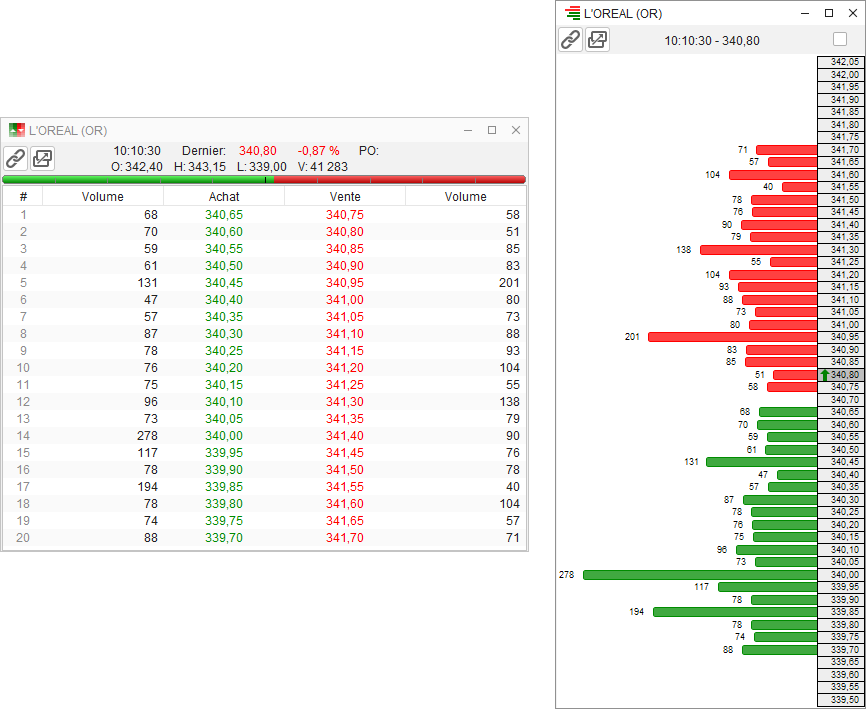
Use the Order Books to place your orders
Axial Finance displays the Trade Order Books (up to 10 levels) under three different forms :
- Directly into the Live Charts with histogram drawing
- In tabular form in a separate window
- In the form of a histogram in a separate window

Select among more than 100 technical indicators those which are the most adapted to your analysis
Technical indicators are the basis of technical analysis, they show and highlight the past and foreseeable market trends.
Axial Finance offers a wide range of customizable indicators (more than 100) that
can be very easily added into graphical charts, either in the upper part of the chart
(together with the price curve) or just below.
In the lower part of the chart, up to 5 indicators called "secondary indicators" can be
displayed simultaneously from a wide selection. A device called slideshow
allows to move vertically these indicators in a mouse clic.
For each indicator the style is customizable : color, thickness, dotted line and curve shape.
In addition, for some indicators like the Moving Average, the drawing can be
done with two colors, green or red depending if the curve is going up or down.
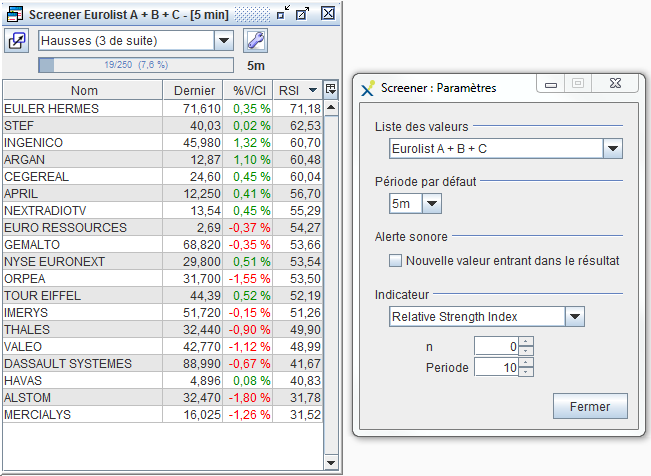
Get with the real-time Screener the stocks which among a full list complies with your decision criteria
The real-time Screener is very useful to automatically and immediately detect stocks that meet user's decision criteria.
From a list of hundreds of stocks Axial Finance detects evey second and displays in a table those who meet user's criterion for decision.
The decision criterion called Screening Rule is defined by an easy logical assembly of basic signals included in the software library, then without needing any writing of programming code. Each signal is evaluated at a defined frequency bar (n minutes, hours, days, weeks or month).
The result of screening may also be sorted according to the value of a technical indicator calculated in real time, thus adding an addtional criterion for research.
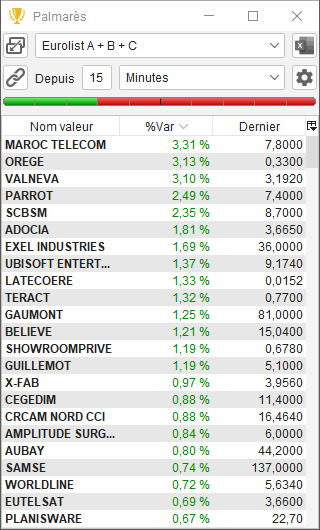
Get with the real-time Winner/Loser Ranker the ordered list of stocks according to price variation over a time period
The Winner/Loser Ranker sorts every second a list which can contain hundreds of stocks, according to the change of price during a programmable period of time : since last day close, since day opening or over a period either in number of minutes, hours, days, weeks or months.
The Winner/Loser Ranker provides a clear indication of the market trend and immediately identifies those stocks with significant price variations over the analyzed period of time.
A Buying/Selling pressure gauge gives the percentage of stocks going up or down.
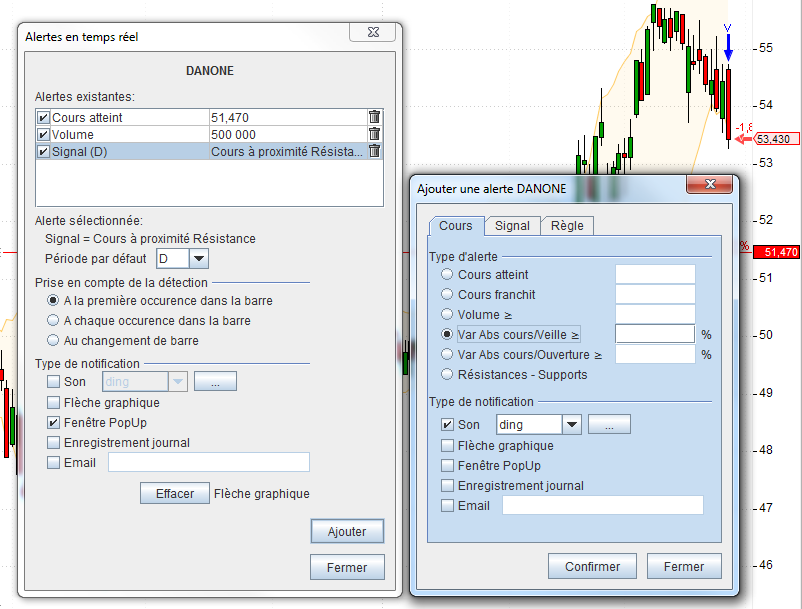
Be immediately alerted when stocks are meeting your decision criteria
Axial Finance allows to set up real-time Alerts on an unlimited number of stocks. For each stocks several types of alerts based on prices, volumes, technical indicators, signals or support/resistance levels can be selected simultaneously. Each alert can have its individual way of user's notification.
Alert types include :
- Reaching or crossing a given price, crossing down a support level, crossing up a resistance level, exceeding a volume value or a price variation percentage.
- Meeting conditions specified by Signals or Screening Rules belonging to the software library.
For each alert, a specific mode of user's notification can be choosen among audio signals, pop-up window, marker on the Live Chart when displayed for the relevant stock, email or recording in the alert book.
A global summary board displays all stocks with the relevant set up detailed alerts. From this board the user can easily modify an alert, eventually disable it temporarily or permanently delete it.
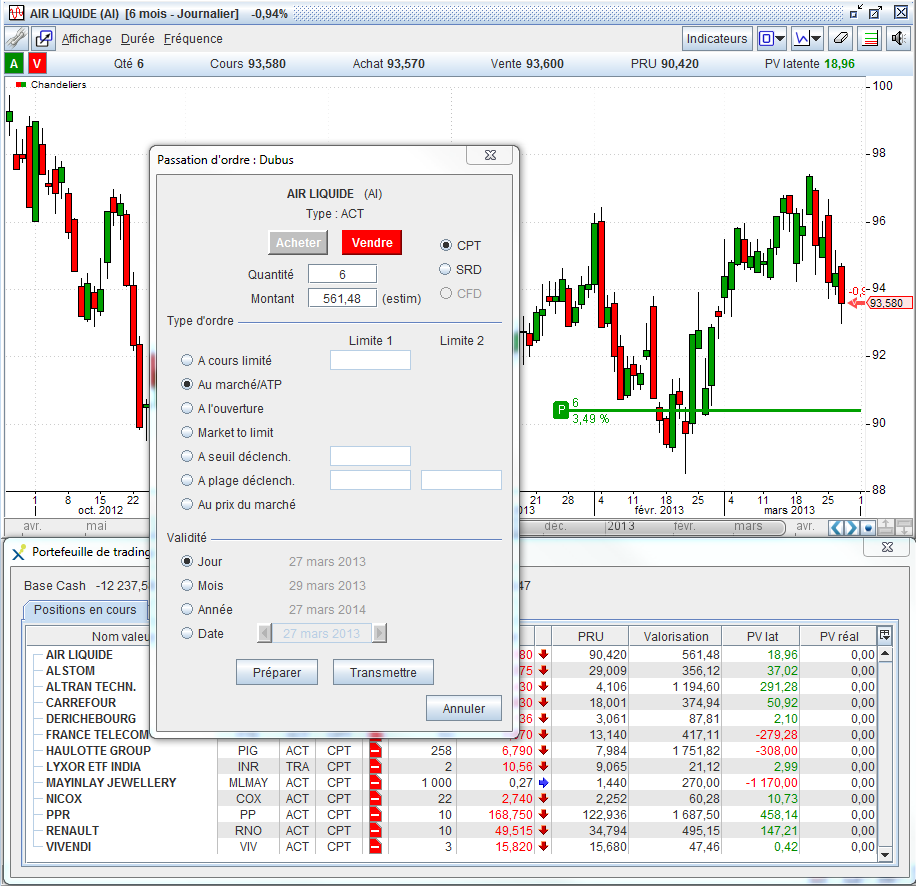
Send your orders to brokers and follow in real-time your portfolios
The brokers Lynx and Interactive Brokers are directly connected with Axial Finance Expert to transmit orders and monitor portfolios in real-time.
Each Live Chart has a Trading Area allowing to transmit orders and to follow the position in real-time. When a trading order is prepared (not yet sent to the broker), actually transmitted to the broker and then executed, the status of the position is drawn on the Live Chart with a color code and relevant data.
The Trading Portfolio displays orders with their current status and open positions
updated in real-time.
This portfolio also stores and displays trading orders prepared in anticipation
of a transmission to the broker.
Limit and Stop trading orders can also be sent directly from the Trade Order Books by just clicking on the desired level of price to fix the limit or stop level.
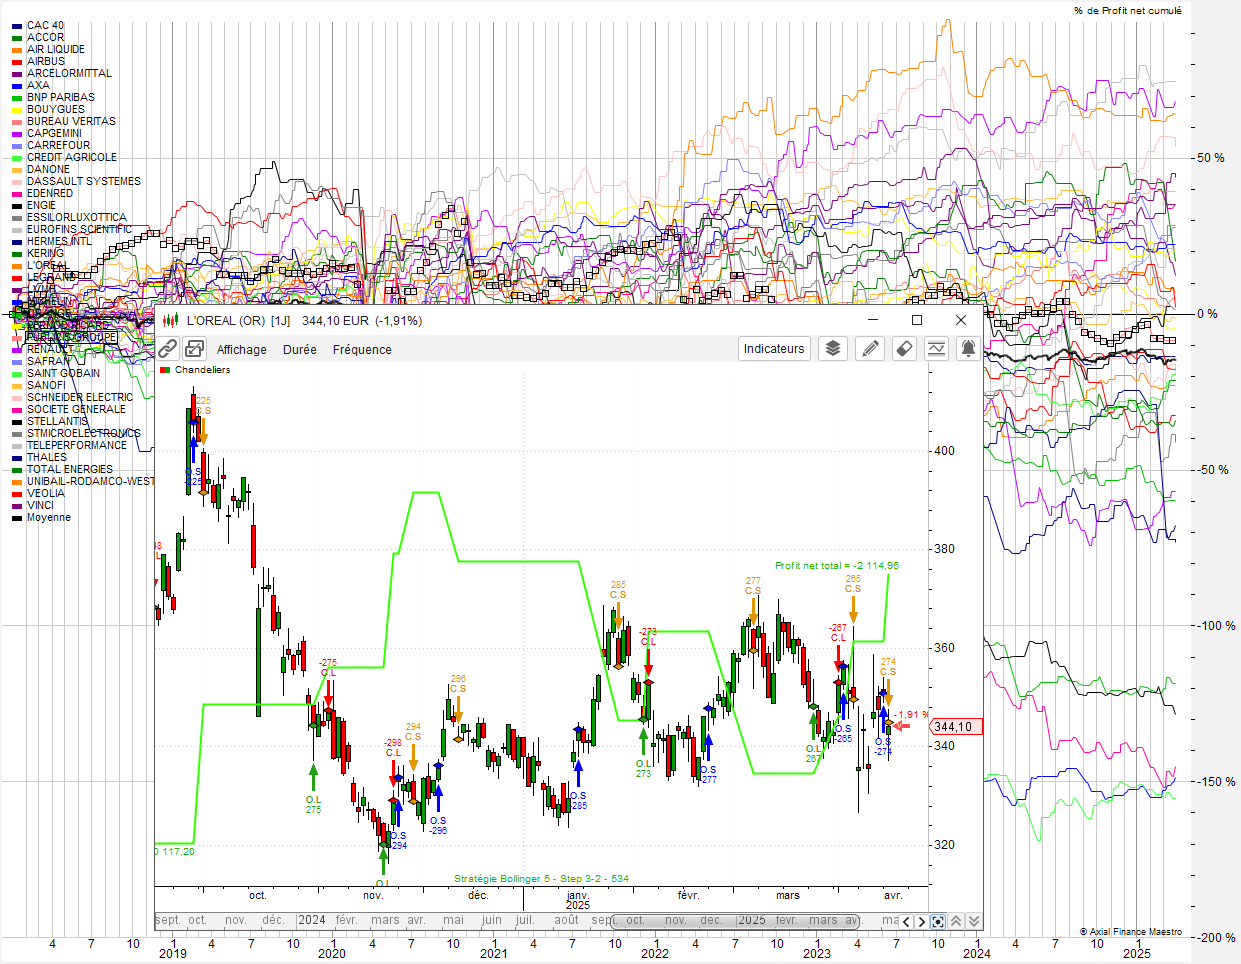
Define and optimize your trading strategies with Back Testing and analyse results on historical quotes
Searching for the best strategies is the first objective of any stock investor. It is fundamental to be able to verify the relevance of the buying and selling decision rules over the historical quotes to identify favorable and unfavorable market factors and then confirm such rules.
The so-called Back Testing function gives to the user an easy to use tool
to achieve this goal.
Each idea for a strategy can be evaluated precisely by identifying opening
and closing positions, gains and risk ("Drawdown") incurred at any time.
Live Charts allow a trader to step through the trading day bar by bar
or through day bars over months and years to assess strategies and adjust accordingly.
Three Back Testing modes are available :
- Apply a strategy to a stock or simultaneously to a list of stocks
- Several strategies applied simultaneously to the same stock
- Apply a strategy to a stock while varying step by step some of its parameters to determine the optimum set of parameters
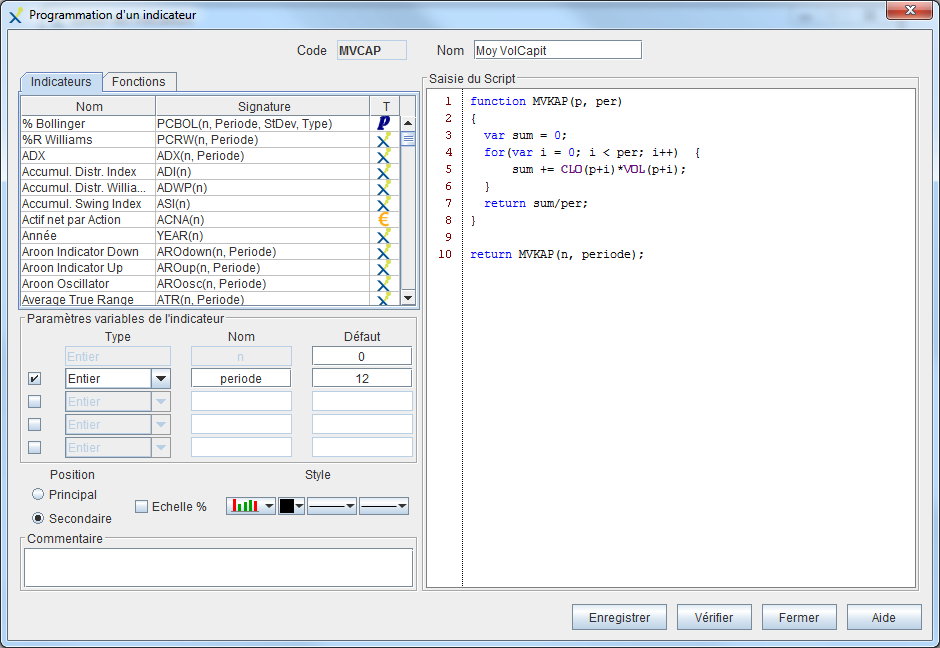
Program your own technical indicators and signals
Axial Finance has an extensive library of technical indicators and signals among the most known.
The user has the ability to add into this library its own indicators and signals programmed with the universal language JavaScript. Indicators and signals can also be easily imported into the libraty from other users.
The programming manual can be downloaded from the documentation page.
It provides the necessary knowledge for programming in JavaScript as well as numerous examples of practical and effective implementation bases.