Technical Indicators
Volatility Ratio
The Volatility Ratio indicator is derived from the Schwager Volatility Ratio introduced by Jack Schwager to identify days of large price variations.
Calculation Method
Volatility Ratio = "True Range of the last day" / "True Range over the period"
where:
- "True Range of the last day" is equal to the largest of the following three variations:
- High of the last day - low of the last day
- High of the last day - closing price of the previous day
- Closing price of the previous day - low of the last day
- "True Range over the period" is equal to "True High" - "True Low", with:
- "True High": Maximum of the high during the period or the closing price of the previous day of the first day of the period
- "True Low": Minimum of the low during the period or the closing price of the previous day of the first day of the period
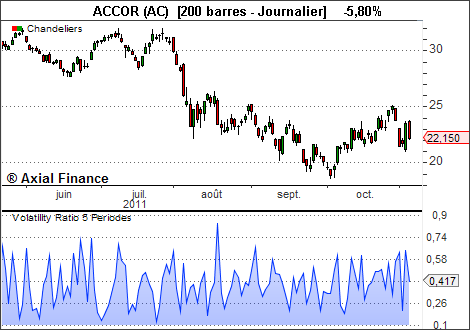
Example