Technical Indicators
Trend Ratio
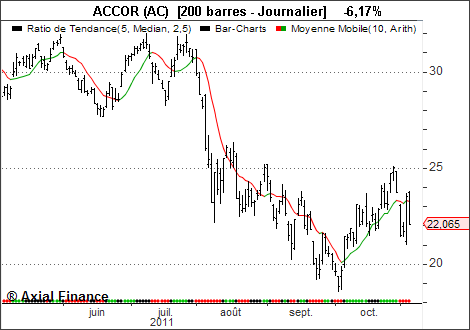
This indicator, Trend Ratio, allows you to know the percentage importance of price variation over a given period. A reference threshold in % defining an average rate of price variation is also chosen.
This indicator is represented as a horizontal line of colored dots that allows characterizing the trend over the defined period relative to the reference threshold:
- Green dots: Prices increase at an average rate greater than or equal to the reference threshold
- Black dots: Prices fluctuate at an average rate lower than the reference threshold
- Red dots: Prices decrease at an average rate greater than or equal to the reference threshold
Calculation method
The linear regression line is calculated over the fixed period and, depending on the case, for closing prices, highs, lows, or median prices. The slope of this line defines a rate of price variation which is then compared to the reference threshold.Example