
Technical Indicators
Swing Pivot
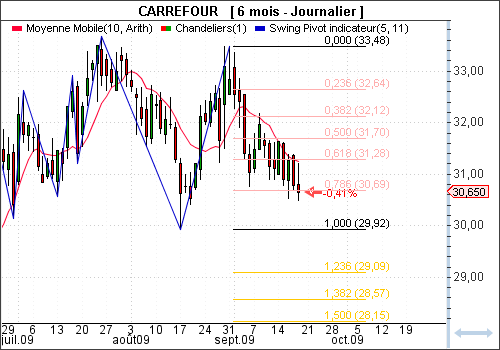
The Swing Pivot indicator determines the price reversal periods between extreme highs and lows. The reversal threshold is set as a percentage of price variation, and depending on the chosen threshold value, the reversal periods can be more or less spaced out.
Display
In the chart, the extreme high and low points are connected by a straight line segment. The last reversal serves as the basis for automatically drawing Fibonacci retracement levels.
This indicator has two programmable parameters:
- The "Threshold" parameter defining the percentage of price reversal
- The "Period" parameter allowing modification of the horizontal width of the Fibonacci levels drawn on the chart
Example
Interpretation
Relative to the last reversal segment, Fibonacci retracements mark price levels at which prices have a high probability of reversing again.In the example above, after a period of rising prices from August 17, 2009, to September 30, 2009, prices have been declining since September 30. A first attempt at an upward reversal on October 7 at the 78.6% retracement was not successful. On September 18, 2009, this same retracement level was broken downwards, suggesting that the next possible reversal level is the 100% retracement.