Technical Indicators
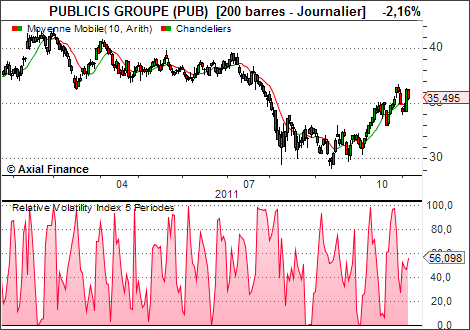
Relative Volatility Index
The Relative Volatility Index, introduced by Donald G Dorsey in 1993, measures the direction of price volatility and is used to confirm the results of a momentum indicator (for example: RSI, MACD, Stochastics, Price Rate Of Change, etc).
This indicator is similar to the Relative Strength Index, but uses the Standard Deviation instead of the daily price variation. Like the RSI, it varies from 0 to 100.
Generally, the time period used is 10 sessions.
Example