
Technical Indicators
Relative Strength %
The Relative Strength % indicator is another graphical representation of Relative Strength which allows comparing two instruments with each other.
Relative Strength is often used to compare the performance of a stock relative to a market index.
Calculation Method
PRL = (initial ratio/current ratio) - 1
where:
- initial ratio: closing price of the market index at origin / closing price of the stock at origin
- current ratio: closing price of the market index at current bar / closing price of the stock at current bar
Example
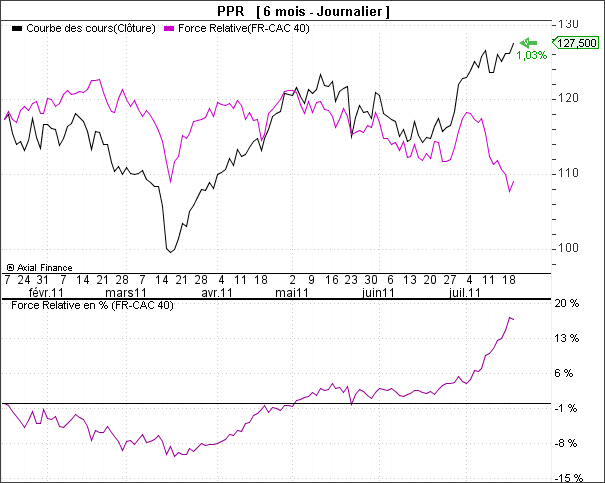
Remarks
The Relative Strength % indicator is plotted in a secondary chart, while the Relative Strength is plotted in the main chart. The percentage representation allows quantifying the stock's relative position compared to the market index.
The starting day for the Relative Strength calculation is the first price visible on the chart (taking into account the zoom position if enabled).
If the historical data of the two instruments have different durations, the application will only plot the Relative Strength over the common history duration of both instruments.