
Technical Indicators
Linear Regression Oscillator
The Linear Regression Oscillator allows for isolating overbought and oversold levels on a security or an index, and generating very precise entry points.
This oscillator is derived from the Linear Regression Curve. For each session, we calculate the difference between the security price and the value of the Linear Regression Curve. The period to use for determining the Linear Regression Curve is generally between 10 and 25.
The Linear Regression Oscillator fluctuates around zero. The deviation from the zero axis represents the difference (in points for an index or in monetary units for a stock) between the prices and the Linear Regression Curve.
Example
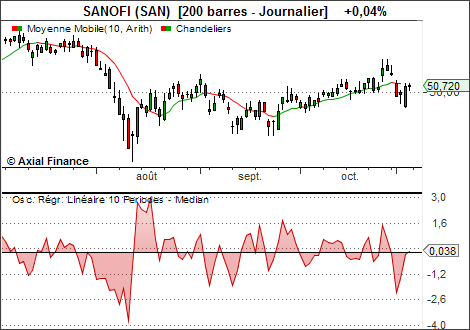
Interpretation
Overbought and oversold levels, respectively above a horizontal line located above the zero axis, or below a horizontal line located below the zero axis, vary as a function of the average price level and volatility.A visual analysis of the oscillator's history allows for determining the most suitable level.