
Technical Indicators
Momentum
The Momentum is one of the most well-known indicators in technical analysis; it is part of the oscillator family. Its objective is to provide a measure of the speed of price evolution over a given period of time.
Momentum is unbounded and evolves around the zero line; it is positive when the market is in a bullish acceleration and becomes negative in the opposite situation. The higher the Momentum, the more overbought the instrument is. Conversely, the lower the Momentum, the more oversold the instrument is.
Example
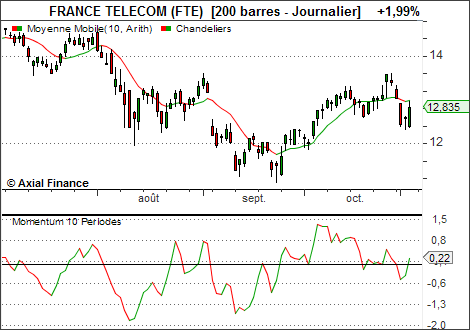
Interpretation
There are several ways to interpret Momentum:- Use Momentum as a trend-following indicator, buying when momentum is very low and turns upwards, and selling when the indicator forms a peak and turns downwards.
- When this indicator forms patterns (Tops, Bottoms, channels...) that follow the same rules as patterns formed by prices. Often, these patterns detected on Momentum go unnoticed on the price charts.
- Use the crossing of the zero line as a signal. In this view, an upward crossing of the zero line gives a buy signal; conversely, its downward crossing will give a sell signal.
- Finally, momentum can be used in the form of divergences between the price curve and the indicator. This is probably the most appropriate use for this indicator.