

Indicateurs techniques
Maximum Plus Haut - Minimum Plus Bas
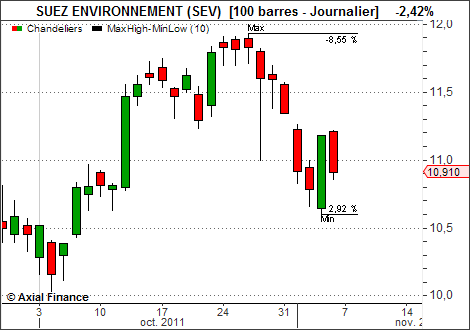
Cet indicateur permet de suivre sur le graphique des cours la position du dernier cours par rapport au plus haut et au plus bas sur une période P.
Cet indicateur permet de suivre les breaks et le retracement sur une période donnée.
Exemple
Interprétation
Deux lignes horizontales pointillées matérialisent les niveaux les plus haut et les plus bas sur la période.L'application indique le pourcentage de proximité du dernier cours par rapport à ces deux niveaux.