
Technical Indicators
Klinger Oscillator
The Klinger Oscillator (or KO) was developed by Stephen J. Klinger. It is volume-based
and is suitable for both short- and long-term analyses.
It satisfies two contradictory objectives: being sensitive enough to signal short-term tops and bottoms,
while remaining accurate enough to reflect the volume movements of assets over the long term.
The Klinger Oscillator is based on the following aspects:
- The price range (daily high - daily low) measures the movement, and volume characterizes the strength of this movement.
- The sum "daily high + daily low + closing price" defines the trend. Accumulation occurs
when this sum is higher than that of the previous day.
Conversely, distribution occurs when the daily sum is lower than that of the previous day.
When the sum is unchanged, the previous trend is maintained. - Volumes produce continuous intraday price variations reflecting the buying or selling pressure of the market.
- The "Klinger Oscillator" quantifies the difference between the number of securities accumulated and distributed each day as "volume force."
- A high and increasing "volume force" should accompany a price growth phase, gradually stabilizing at the end of the growth phase, or even at the beginning of the following price decline phase.
- One can easily follow the evolution of this "volume force" by converting this "volume force" into an oscillator calculated by taking the difference between its medium-term Exponential Moving Average (34 days according to S. Klinger) and its long-term Exponential Moving Average (55 days according to Stephen Klinger), then using a trigger signal by calculating the short-term Exponential Moving Average of this difference (13 days according to Stephen Klinger).
Example
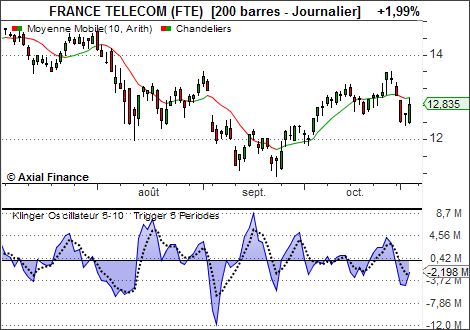
Interpretation
Stephen Klinger provides the following guidelines for using the indicator:
- The most reliable signals occur when the indicator moves in the same direction as the price trend.
- The most significant signals occur when the indicator diverges from the prices, especially at new highs or lows in overbought or oversold areas.
- If the trend is bullish, buy when the indicator falls to an unusual level below zero, then rises and crosses its trigger line.
- If the trend is bearish, sell when the indicator climbs to an unusual level above zero, then falls back and crosses its trigger line.
Remarks
While the indicator gives good results when taking positions in the direction of the trend, it seems less effective against the trend.
However, if the analysis is supplemented with another indicator, the result can be improved.
The Williams Accumulation Distribution is recommended to confirm
oversold or overbought situations, and the MACD to confirm the direction
of short-term price movement.