Technical Indicators
Gann Grid
Refer to the Gann Angles page.
Calculation Method and Interpretation
Identify on the price chart a period corresponding to a significant trend cycle and draw a line connecting the highest high and lowest low (or vice versa) of that period.
To obtain the "Gann Grid", draw two series of parallel lines:
- A first series of lines parallel to the previous line, each spaced from the other by one unit of time.
- A second series of parallel lines, with inverse slope to the previous series, each spaced from the other by one unit of time.
This grid forms a set of support and resistance lines. When a price breaks through a trend line, Gann considers that the price target becomes the next line and so on.
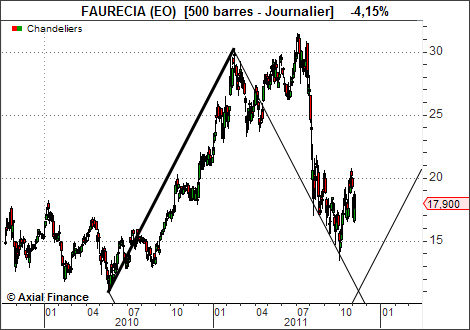
Example