
Axial Finance Global Trader

A Trading room at your disposal
The workspace is fully configurable and can include the following windows spread over one or more screens depending on the hardware configuration of the computer :
- An unlimited number of Easy-To-Use Live Charts working on a tick by tick basis
- Up to 10 Watch Lists, each with a maximum of 1500 stocks (equities, futures, indices, Forex, ...) with auto-sorting capability on the chosen column.
- Up to 10 real-time Market Screeners, each with a maximum of 1500 stocks, to detect every seconds thoses stocks meeting the user's selection criteria.
- Up to 10 real-time Winner/Loser Rankers, each with a maximum of 1500 stocks. The Winner/Loser Ranker classifies every seconds the listed stocks according to their price variations over a selected period of times in minutes, hours, days, weeks or months.
- An unlimited number of Trade Order Books (Level 2)
- An unlimited number of Lists of Trades from the day opening
The number of workspaces has no limit, each saved under a chosen name and easily recalled.
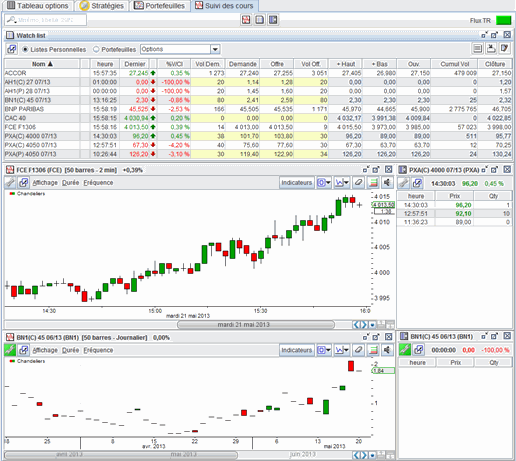
Follow the prices of options, futures and stocks in real time
Axial Finance Global Trader as a workspace to monitor in real time prices of all stocks and options :
- in Live Charts which number simultaneously open has no limit
- in a Watch list for displaying a complete list of stocks with last prices, trading hours, offer and ask prices, ...
- list of trades per stock executed since trading day opening
A hundred of customizable technical indicators are available in the Live Charts for graphical and technical analysis. These charts offer the same facilities as in Axial Finance Expert.
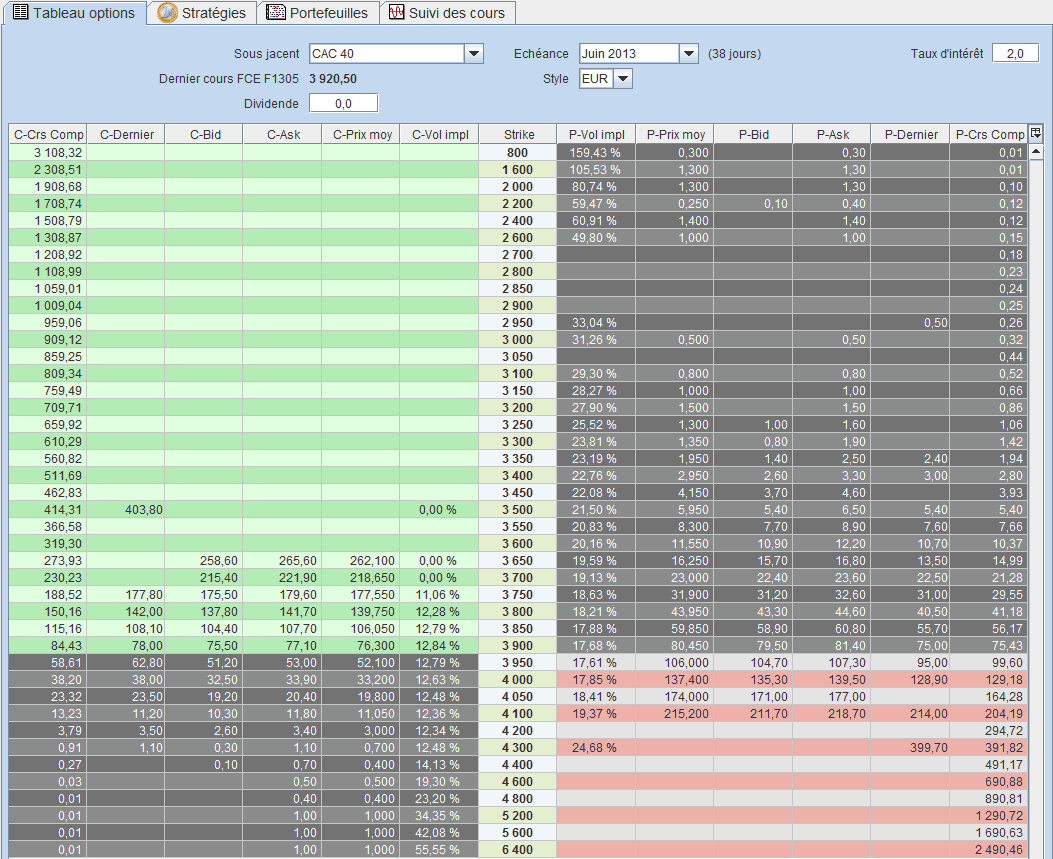
Search options based on the implied volatility updated in real time
For an underlying and maturity selected, Axial Finance Global Trader calculates and displays in real-time in a global table all CALL and PUT options classified by increasing strikes with the implied volatility and the Greek parameters (Delta, Gamma, Theta, Vega and Rho) options.
The options in the money and out of the money are distinguished by a different background color: green and red respectively for CALL and PUT in the the money, gray for options out of the money.
Identification of options meeting for instance a percentage of implied volatility is immediate, as well as reading the last quoted price and the best offer and demand prices.
The dividend and interest rates can be set up and applied to all listed options.
Settlement prices are also part of the data displayed.
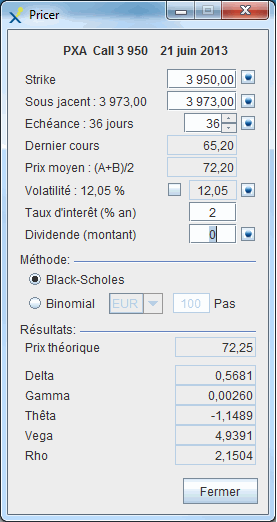
Calculate the price of an option
The calculation of the price of an option can be done independently in a window Pricer simply opened by clicking on the name of the option.
At the opening of a Pricer window, the data fields are set up with relevant values known at this time.
Afterwards, the user can change these data : strike, underlying, time to maturity, implied volatility,
dividend and interest rates.
The recalculation of the option price is automatic at each change of any data, according to two calculation models : Black-Scholes or binomial.
There is no limit to the number of Pricer windows opened simultaneously.
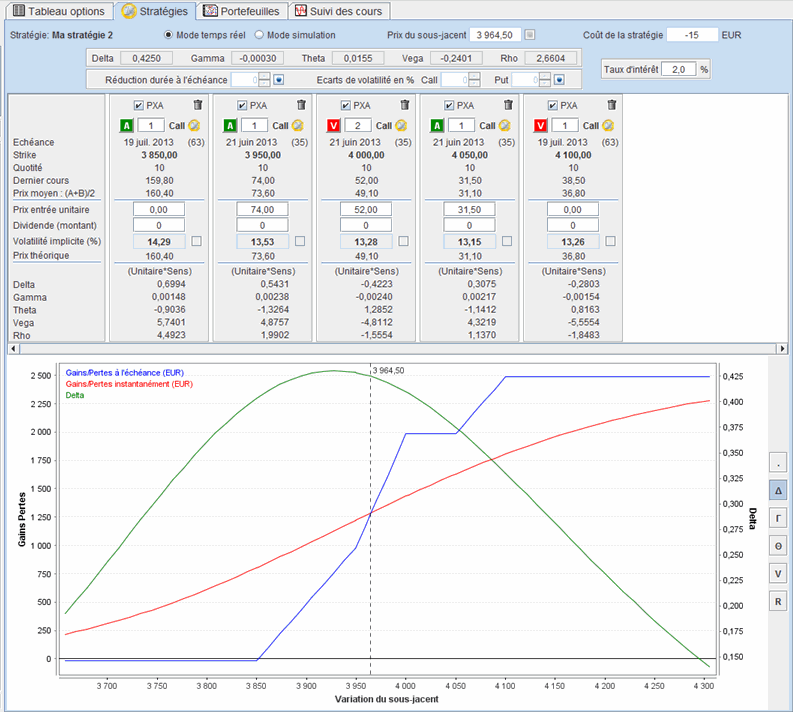
Find the best strategy based on simulated market changes
The search for the best strategy relative to an underlying is an essential function. This research is carried out either with the current prices updated in real time, either by simulation with specific data set up by the user.
The man-machine interface of Axial Finance Global Trader was especially designed to facilitate the research : adding options in the strategy by dragging and dropping from the global list, easiness to change important parameters like sense of order (Buy or Sell), number of items, premium, underlying price, time to maturity, implied volatility and dividends.
The result of the strategy is presented in a graph with the price of the underlying as x-scale.
It shows the evolution of profits and losses at maturity, profits and losses at the current moment
and the Greek parameters (Delta, Gamma, Thetra Vega and Rho).
The cost of the strategy based on the premiums paid and the number of options is indicated.
The selection of the simulation operating mode will stop price updating in the real-time and will allow to focus on the consequences of a specific change in the underlying price, the reduction of the term to maturity, the change of the dividend or the variation of implied volatilities.
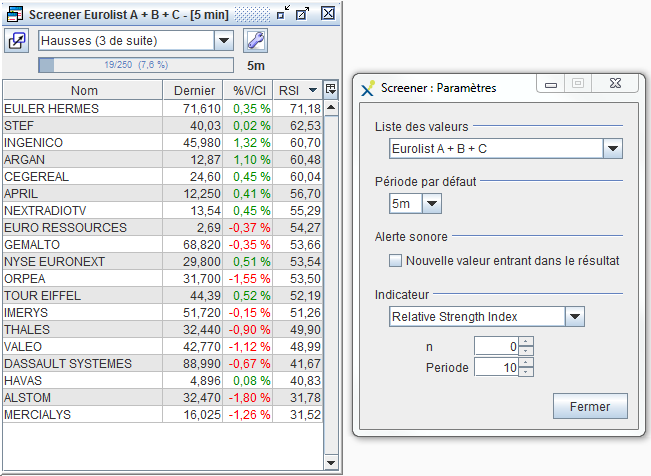
Get with the real-time Screener the stocks which among a full list complies with your decision criteria
The real-time Screener is very useful to automatically and immediately detect stocks that meet user's decision criteria.
From a list of hundreds of stocks Axial Finance detects evey second and displays in a table those who meet user's criterion for decision.
The decision criterion called Screening Rule is defined by an easy logical assembly of basic signals included in the software library, then without needing any writing of programming code. Each signal is evaluated at a defined frequency bar (n minutes, hours, days, weeks or month).
The result of screening may also be sorted according to the value of a technical indicator calculated in real time, thus adding an addtional criterion for research.
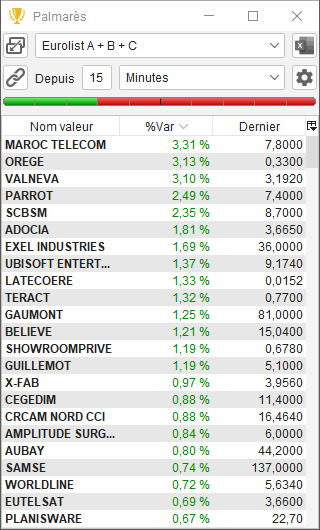
Get with the real-time Winner/Loser Ranker the ordered list of stocks according to price variation over a time period
The Winner/Loser Ranker sorts every second a list which can contain hundreds of stocks, according to the change of price during a programmable period of time : since last day close, since day opening or over a period either in number of minutes, hours, days, weeks or months.
The Winner/Loser Ranker provides a clear indication of the market trend and immediately identifies those stocks with significant price variations over the analyzed period of time.
A Buying/Selling pressure gauge gives the percentage of stocks going up or down.
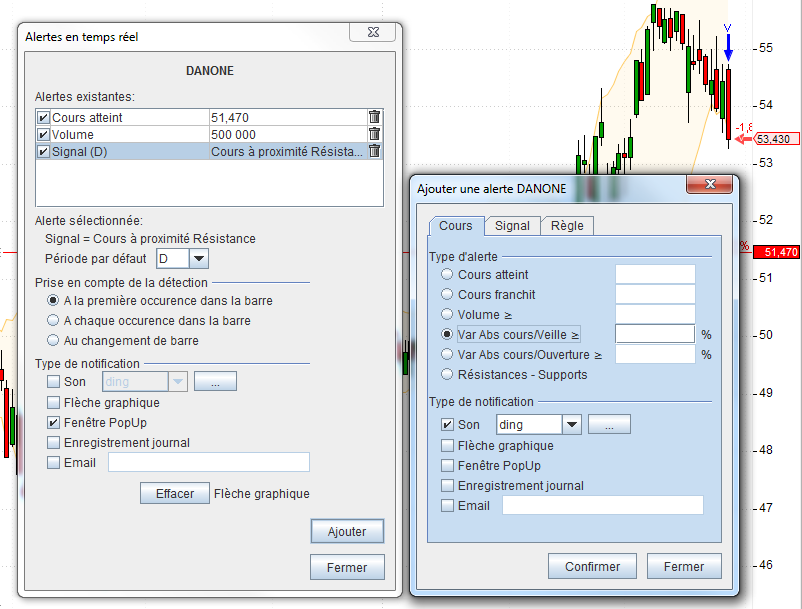
Be immediately alerted when stocks are meeting your decision criteria
Axial Finance allows to set up real-time Alerts on an unlimited number of stocks. For each stocks several types of alerts based on prices, volumes, technical indicators, signals or support/resistance levels can be selected simultaneously. Each alert can have its individual way of user's notification.
Alert types include :
- Reaching or crossing a given price, crossing down a support level, crossing up a resistance level, exceeding a volume value or a price variation percentage.
- Meeting conditions specified by Signals or Screening Rules belonging to the software library.
For each alert, a specific mode of user's notification can be choosen among audio signals, pop-up window, marker on the Live Chart when displayed for the relevant stock, email or recording in the alert book.
A global summary board displays all stocks with the relevant set up detailed alerts. From this board the user can easily modify an alert, eventually disable it temporarily or permanently delete it.

Get immediately with TickFlow those stocks starting a significant price move
Tickflow is a totally innovative tool for real-time detection of stocks that suddenly experience a great number of trades which signals the beginning of a strong move upward or downward.
All trades relative to a list of stocks are shown in synthetic form in a table with configurable dimensions to visually highlight those stocks that suddenly are experiencing a high volume of trades.
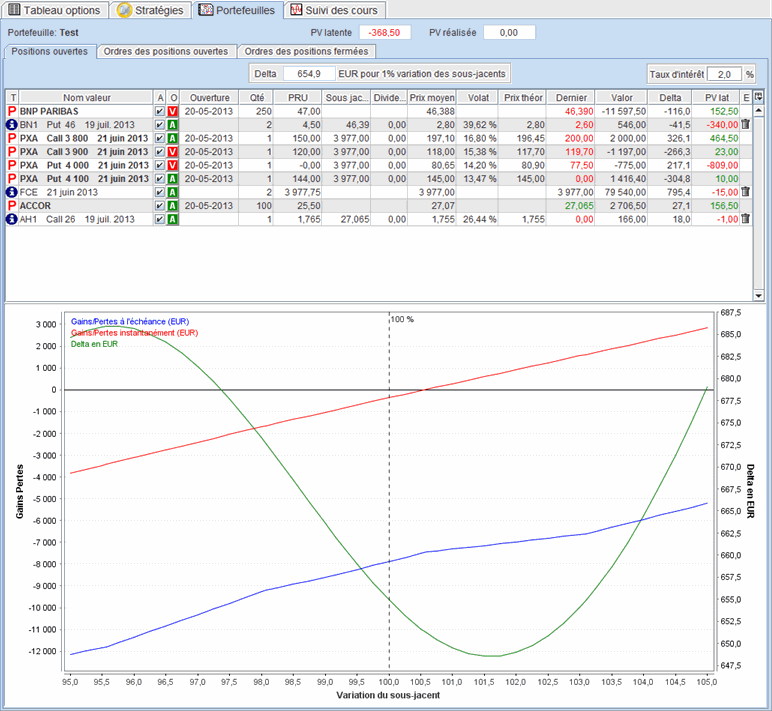
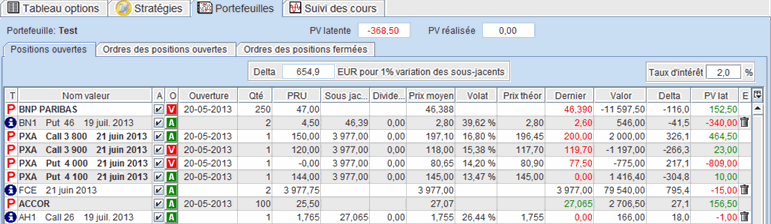
Analyze the impact on your portfolios with temporary added positions
The analysis of a portfolio is different from the search for the best strategy as above due to the fact that a portfolio contains options with multiple underlying stocks not necessarily correlated with options.
Axial Finance Global Trader distinguishes in the portfolio the positions relative to orders transmitted to the market and those positions referred to as temporary positions that are temporarily present in the portfolio for analysis but whose orders have not yet been transmitted for execution.
The status of the portfolio calculated in real-time is also presented in graphical form
with a x-scale based on the variations of the underlyings prices, variations taken into account
as a percentage of changes with respect to the current price of each underlying.
The potential profit is displayed in real time for the portfolio and each position individually.
Knowledge of the portfolio Delta is an important factor in the analysis. It is calculated and displayed as a monetary amount given the different underlying stocks in the portfolio and not in percent as in a strategy based on a single underlying.
Manage your portfolios with the method of delta-neutral
The management of a portfolio based on Delta-neutral is a classical method whose implementation is not easy when the portfolio contains numerous positions with multiple underlying stocks.
The method of determining the Delta adopted by Axial Finance Global Trader provides a precise
and immediate knowledge of its value with the most complex portfolios.
The man-machien interface implemented in the portfolio makes it easy to temporarily change any
parameter of each position to determine the effect on the value of the Delta,
value calculated as a monetary amount as described in the above point.
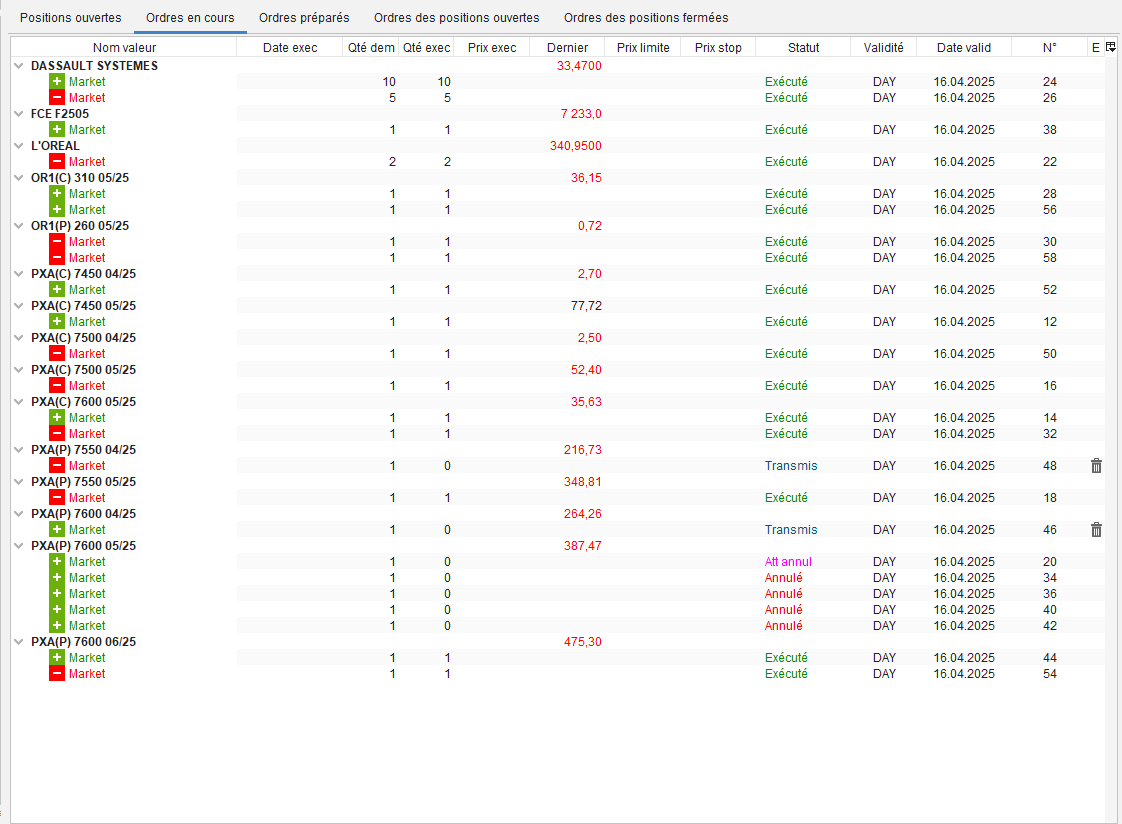
Follow your portfolio in real time
The portfolio displays in real-time :
- the opened positions for the orders already executed by the broker and the positions called temporary positions for orders not yet transmitted
- the corresponding list of orders in each open position
- the history since the portfolio was created of the closed positions with relevant detailed orders
Each order of a particular position gives the following details: date of the order, direction, quantity, cost, amount, potential profit and the realized profit.