
Indicateurs techniques
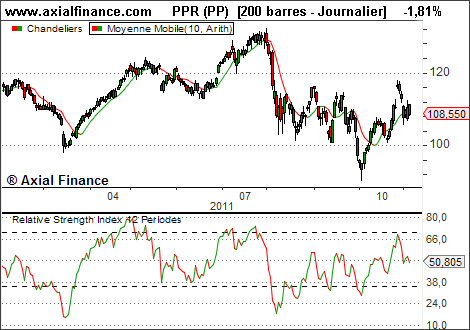
Relative Strength Index
The Relative Strength Index (or RSI) is a very popular momentum indicator developed by J. Welles Wilder Jr and detailed in his book New Concepts in Technical Trading Systems.
The RSI compares the upward price variations to the downward variations over a given period.
Originally, Wilder used a 14-period window, but periods of 7 and 9 are generally used for short-term cycles, and 21 or 25 days for intermediate cycles.
RSI variations are smoother than those of the Momentum or Rate of Change indicators. The RSI is designed to vary between 0 and 100, which allows for defining overbought and oversold levels.
Calculation Method
RSI = 100 * H / (H + L)
where:
- H: the sum of closing price variations over the period between today and yesterday, when the variation is positive
- L: the sum of closing price variations over the period between today and yesterday, when the variation is negative
Example
Interpretation
RSI analysis is based on observing divergences between the indicator itself and the prices. Thus, when a security reaches new highs and the RSI fails to create a higher peak than the previous one, a reversal can be anticipated.In his book, Welles Wilder points out five major points for using the RSI:
- RSI above 70% or below 30%.
The RSI reaches its peaks and troughs before the price does. More precisely, this means that when the RSI exceeds the 70 threshold, it sends an alert, indicating that the instrument will form another major peak, which will likely be the last before a reversal. - The RSI forms patterns similar to those formed by price action, such as a "head and shoulders".
- Breakout of RSI resistances or supports.
When the RSI breaks above a previous high or below a previous low, a likely reversal in prices will follow. - RSI supports and resistances
The RSI sometimes breaks through a support or resistance level drawn on the RSI itself, even when no such situation is detected on the price chart. - Divergence of RSI from prices.
As mentioned above, the RSI fails to exceed the previous peak, while the prices do. At this peak, it is advisable to liquidate all or part of a position because a reversal is likely, as signaled by the RSI.
Remarks
It is observed that the RSI yields much better results on non-cyclical stocks—that is, on stocks that evolve according to company fundamentals rather than market sentiment.The RSI can be used for "real-time" trading, i.e., on "Intraday" prices or "Real-Time Feed". The RSI period is then
defined by two parameters. The first, which corresponds to the base period, determines the time interval in seconds
to take into account for sorting the data to be processed.
The second parameter determines the number of base periods over which calculations will be performed.
The RSI period is the product of these two parameters.