
Technical Indicators
Stochastic RSI
The Stochastic RSI, also known as Stoch RSI, was developed by Tushar Chande and Stanley Kroll.
It is an oscillator that, as its name implies, applies the calculation method of the classic
Stochastics indicator to the values of the RSI. It is therefore
an "indicator of an indicator".
While the classic Stochastics indicator measures the relationship between closing prices
and daily deviations, the Stochastic RSI measures the RSI relative to its variation over
a period.
This indicator varies between 0 and 1.
Calculation Method
It is calculated as follows:
Stoch RSI = (RSI - MinimumRSIn) / (MaximumRSIn - MinimumRSIn)
where:
- RSI: the RSI value for period n
- MinimumRSIn: the minimum RSI value over period n
- MaximumRSIn: the maximum RSI value over period n
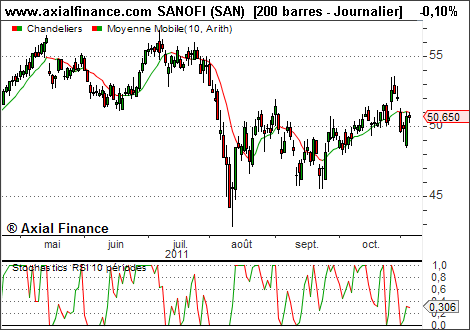
Example
Interpretation
The Stochastic RSI can be interpreted in several ways:- Overbought or Oversold Signal: when the Stochastic RSI is above 0.80, the instrument is considered
overbought and a downward correction could occur in the near future.
Conversely, when the Stochastic RSI is below 0.20, the instrument is considered oversold and an upward correction could occur in the near future.
Some consider that crossing the 0.20 level upwards is a buy signal, and that crossing the 0.80 level downwards is a sell signal. - Central Level Crossing Signal: Some consider that crossing the 0.50 level confirms another signal.
Others consider that crossing the 0.50 level upwards after an oversold situation is a buy signal, or conversely, crossing the 0.50 level downwards after an overbought situation is a sell signal. - Divergence Signal: If the Stochastic RSI is rising and crosses the 0.20 level while the closing price
is falling, then this divergence can be interpreted as a buy signal.
Conversely, if the Stochastic RSI is falling and crosses the 0.80 level while the closing price is rising, then this divergence can be interpreted as a sell signal.