
Technical Indicators
SuperTrend (VOL)
The SuperTrend is an indicator developed by Olivier Seban and widely used by futures traders.
It is a trend indicator which, unlike other indicators of this type, takes volatility into account.
The SuperTrend filters price fluctuations due to volatility more significantly than other trend indicators. Consequently, as long as the volatility persists, the trader can follow an intact trend for longer.
For example, compared to MACD or Parabolic SAR indicators, a short but violent movement in prices is enough to change the trend. However, after this brief deviation, the trend often continues, whereas the trader has likely already abandoned their position.
In Axial Finance, the SuperTrend exists in two different types: VOL and ATR, each type using a different method for calculating volatility.
The VOL type calculates volatility from the weighted average of the price range. This indicator includes four parameters. It easily adapts to trading on other securities (Stocks, Forex, etc.) by adopting the corresponding settings.
It consists of a curve that alternates above and below prices to indicate the direction of the trend.
Calculation Method
The method uses the four parameters, period, price, ratio, and type, specified below.
Up = WMA(price, period) + ratio*WMA(Volatility, period)

Down = WMA(price, period) - ratio*WMA(Volatility, period)


where WMA = Weighted Moving Average and Volatility = (High - Low)/2


Stop = Up (if Trend = bearish) or Down (if Trend = bullish)

TrendPrice: determined by the Type parameter

Trend turns bullish when TrendPrice > Up

Trend turns bearish when TrendPrice < Down
Indicator Parameters
period: the calculation period for the weighted moving averages (10 by default)

price: Median (default), Close, High, Low, Typical

ratio: to weight volatility (1.8 by default)

type: to define the choice of TrendPrice according to the following options:

       1 for TrendPrice = Close

       2 for TrendPrice = (High + Low)/2 (default choice)

       3 for TrendPrice = (High + Low + Close)/3

       4 for TrendPrice = (High + 2*Low + Close)/4

       5 for TrendPrice = (High + Low + Close(-1))/3

       6 for TrendPrice = (High + 2*Low + Close(-1))/4
Example
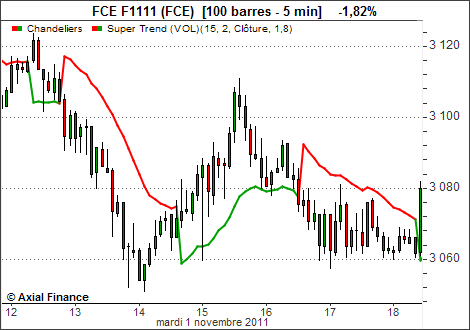
Interpretation
The trend is bullish when the curve is green. It then lies below the prices.
The trend is bearish when the curve is red. It then lies above the prices.
The previous example well illustrates the maintenance of the trend during brief changes in the direction of price variations.
The choice of the "ratio" parameter allows for more or less filtering of these variations and must be adapted to the type of securities being tracked.
A ratio of 1.8 is characteristic of stocks traded on a daily basis.