
Technical Indicators
Williams Accumulation Distribution
The Williams Accumulation Distribution (or W-A/D) indicator created by Larry Williams seeks to measure market pressure.
Calculation Method
W-A/D = Cumulative(Volume * K)
where term K is, depending on the case:
- If today's closing price is higher than yesterday's: K = Today's closing price - "True Range Low"
- If today's closing price is lower than yesterday's: K = Today's closing price - "True Range High"
- If today's closing price is the same as yesterday's: K = 0
- "True Range Low": Maximum of yesterday's closing price and today's low
- "True Range High": Maximum of yesterday's closing price and today's high
Example
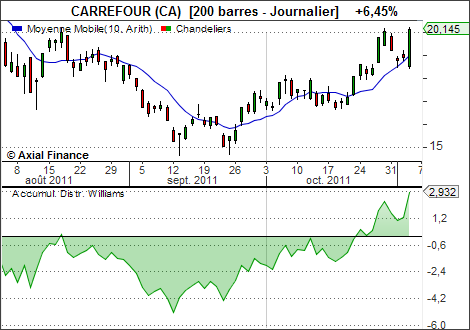
Interpretation
Williams recommends using this indicator when it diverges from prices:- Sell if the price reaches a new high and the W-A/D fails to reach a new high.
- Buy if the price reaches a new low and the W-A/D fails to reach a new low.