
Day By Day Technical Analysis
Ariane Software has partnered with Day By Day to offer you professional analyses integrated directly into your Axial Finance software.
Day By Day produces nearly 200 analyses every day and constantly monitors market trends.
- The analyses cover approximately 250 stocks among the leading French and American values, providing you with a clear opinion for a two-week and two-month outlook.
- The notes and comments will allow you, through commented and explained charts, to understand the market orientation.
- You will be kept informed of signals given by the market, of stocks not to be missed, those to prioritize or those to avoid.
Day By Day analyses are available by subscription in Axial Finance Premier, Axial Finance Expert and Axial Finance Maestro.
Each analysis includes the following information:
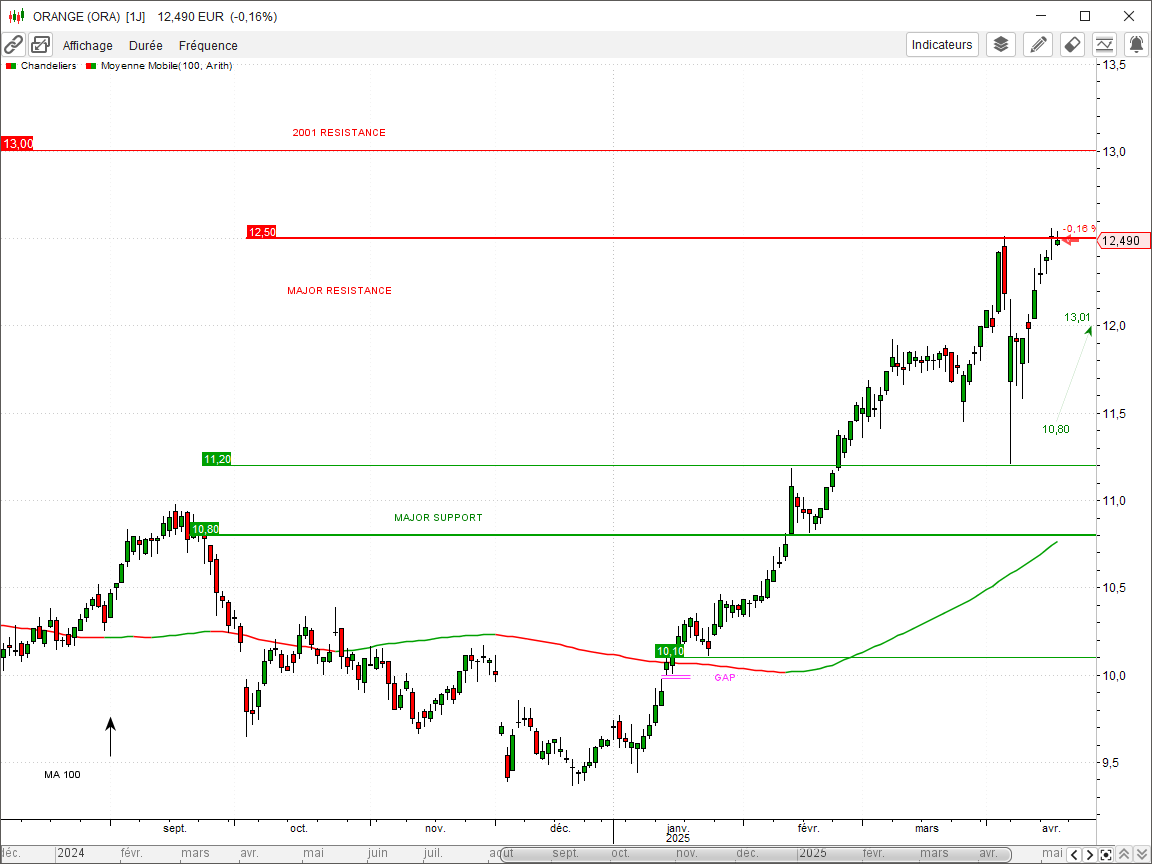
- Three resistance levels and three support levels.
- Remarkable chart patterns: channels, triangles, head and shoulders, gaps, etc.
- Short-term and medium-term opinions.
- The target price and the invalidation threshold in the case of a positive or negative short-term opinion.
- The bullish and bearish reversal thresholds in the case of a neutral short-term opinion.
- The short-term forecast and the medium-term context.
This data is presented both within each price chart and in a global summary table summarizing all resistance and support levels by stock exchange.
Example of a chart with Day By Day analysis
Day By Day Summary Table
The summary table presents the following information for all stocks:
- The short-term and medium-term opinion summarized in three possibilities: positive (green dot), negative (red dot), or neutral (blue dot).
- Short, medium, and long-term support and resistance levels.
- The percentage gap between each support/resistance level and the last price of the stock.
