Technical Indicators
Gann Angles
W.D. Gann is a well-known theorist of cycle analysis. He shares with Elliott the belief that stock markets are subject to fluctuations influenced by nature. However for Gann, the rhythm that conditions price movements is not based on the golden ratio.
Gann prefers to emphasize the relationship between time and price. According to his theory,
during one unit of time, the price will progress by one monetary unit, meaning geometrically in a
linear chart, it will follow a slope of 45°.
Of course this progression is not linear and the price will experience oscillations that will lead it to
other intermediate lines that act as support or resistance around the central axis.
The price chart will thus evolve according to a geometric pattern composed of lines that form angles or
a grid.
Calculation Method and Interpretation
Identify on the price chart a period corresponding to a significant trend cycle and draw a line connecting the highest high and lowest low (or vice versa) of that period.
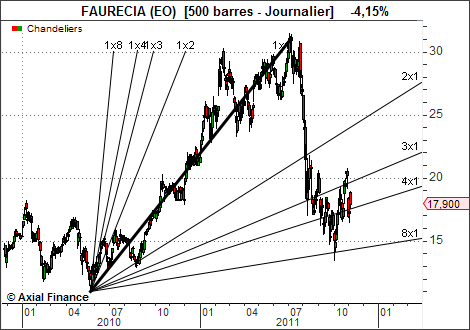
To obtain "Gann Angles", draw lines with the following angle orientations:
- 82.5°, 75°, 71.25°, 63.75°, 45°, 26.25°, 18.75°, 15° and 7.5°
- corresponding respectively to 8 price units per 1 time unit (1*8), 4 price units per 1 time unit (1*4), etc. down to 1 price unit per 8 time units (8*1).
Some of these lines are more significant support and resistance levels than others.
These include the central 45° line (or 1*1) and those on either side at 63.75° (or 2*1) and
26.25° (or 1*2).
When a price breaks through a trend line, Gann considers that the price target becomes the next line and so on.
Example