Technical Indicators
Fibonacci Projections
Fibonacci, a mathematician from the early 13th century, discovered a mathematical sequence of numbers that plays
a key role in the cyclical evolution of phenomena in general.
The Fibonacci sequence is calculated as follows :
U(n) = U(n-1) + U(n-2)
Thus, the first numbers are: 1, 1, 2, 3, 5, 8, 13, 21, 34, 55, 89, 144, 233, etc.
This sequence has remarkable properties:
- As n approaches infinity, the ratio of two consecutive numbers approaches 1.618, which is the golden ratio of mathematics, or 0.618 its inverse, the golden ratio.
- The inverse of the golden ratio is the golden ratio, their difference is 1.
- As n approaches infinity, the ratio U(n)/U(n-2) approaches 2.618 or its inverse 0.382
Forecasts based on the Fibonacci Projections method follow the principle that prices evolve cyclically according to the rhythm given by the golden ratio.
Calculation Method and Interpretation
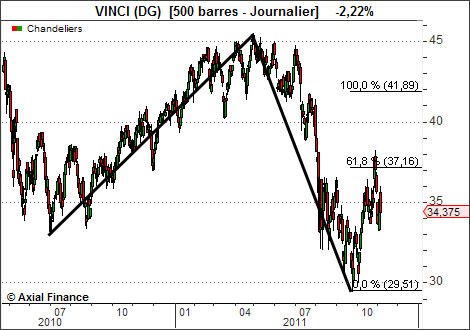
Fibonacci Projections, as opposed to Retracements or Fibonacci Extensions, take into account two significant and successive opposite price trends. Two line segments are drawn in succession, the first connecting the lowest low to the highest high (or vice versa) of the first trend, the second connecting this highest high (or lowest low) to the lowest low (or highest high) of the second trend.
The price range separating the two extremes of the first trend serves as the basis for calculating Fibonacci projections. Typically four projection levels are displayed corresponding to variations of 61.8%, 100%, 161.8% and 261.8% of this range from the end of the second trend. Horizontal lines are drawn for each level, acting as support and resistance lines.
Shortly after two major trend reversals, "Fibonacci Projections" define price target levels for the anticipated correction.
Example