
Technical Indicators
Chaikin Volatility
The Chaikin Volatility is an indicator based on the comparison between the highest and lowest prices of a security. It is therefore based on the "range" (range = high - low) to quantify a stock's volatility.
Calculation Method
First, the Exponential Moving Average at 10 days of the "range" is calculated, and then the variation (in percentage) of the value of the previously calculated average compared to the one calculated 9 days earlier.Example
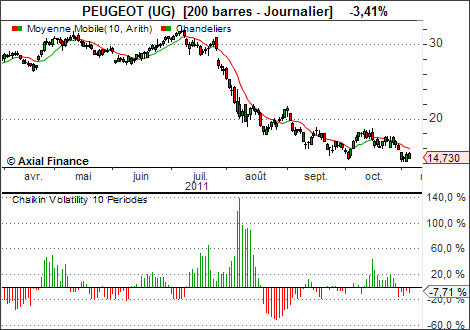
Interpretation
Volatility can be interpreted in two ways:- Either we consider that the peaks observed in a security's historical data are generally accompanied by an increase in volatility (because investors become nervous and indecisive) and that troughs show low volatility (because investors become weary).
- Or we consider (and this is the method defended by Chaikin) that the increase in volatility, observed over a short period, indicates that a trough is near and that a decrease in volatility, observed over a long period, announces the imminence of a peak.