
Technical Analysis and Trading Software
Axial Stock Trader for Smartphone and Tablet allows to perform :
This software Application belongs to the range of trading softwares developped by Ariane Software.
End Of Day quotes for above mentionned exchanges are available free of charge.
To receive Real-Time quotes (in streaming), an internet wifi connection is necessary as well as
the relevant subscription on the internet site www.axialfinance.com
Username ans password supplied at subscription have to be entered by the user in the Application Parameters screen.
Application main screen
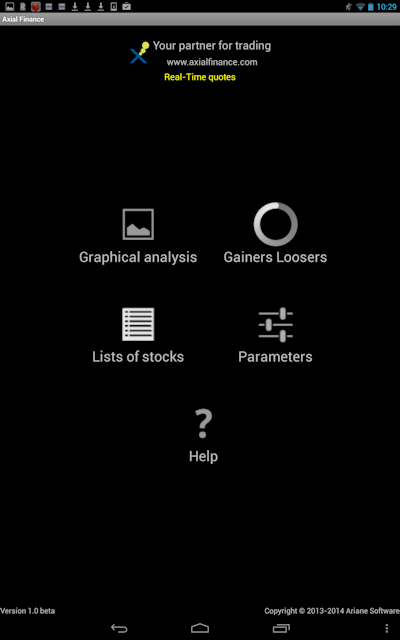
On the Application main screen, touch down on the icon Graphical analysis. The price chart opens with the last selected stock as well as the last selected chart parameters.
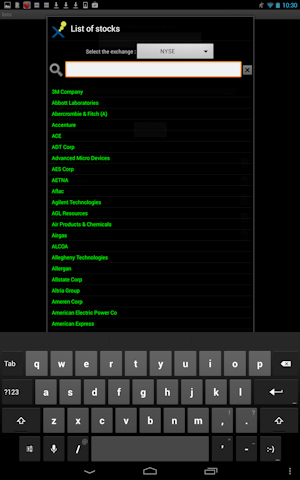
Touch down on the stock name at the top left of the chart to open the list of all available stocks.
Select the exchange then the stock in the list hereunder or reduce this list by entering into
the search field the first characters of a stock name.
Touch down on the desired stock name in the list.
At the bottom of the screen, the Android action bar includes an icon with three vertical dots
to open the chart menu.
This menu provides the three following options :
Touch down on the relevant option in the chart menu, select the frequency for the End Of Day or Intraday quotes
and the maximum chart duration.
According to the selected frequency the possible durations are proposed.
Touch down on the relevant option in the chart menu to open the hereunder window.
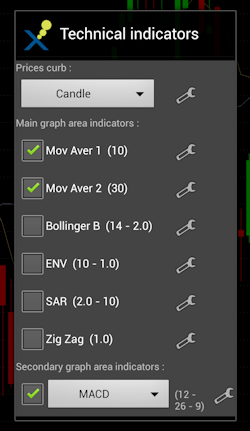
This windows shows :
Beside the indicator name are shown between brackets the parameters of this indicator.
To modify these parameters, touch down on this icon ![]()
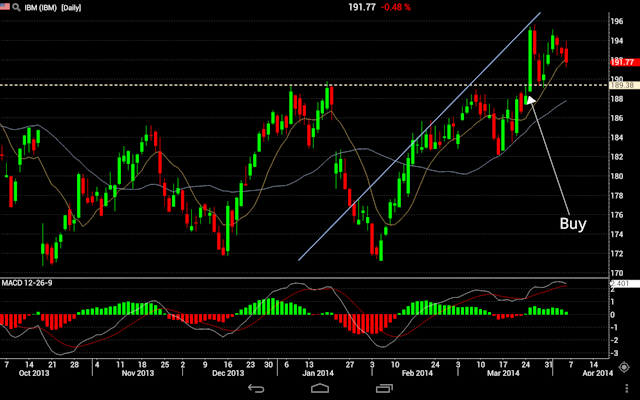
At first opening, the chart is in default position, ie filling all the available space for the selected frequency and duration.
To horizontally translate the chart, slide on the screen with the finger excluding the vertical and horizontal scale areas.
To horizontally zoom, slide on the screen with two fingers excluding the vertical and horizontal scale areas.
To automatically retrieve the default position, touch down the icon ![]() in the right bottom corner of the chart.
in the right bottom corner of the chart.
Basically, the vertical scale is automatically computed to fill all the vertical available space.
To vertically zoom, slide with the finger on the vertical scale area from either the upper part or the lower part of the scale.
To automatically retrieve the default position, touch down the icon ![]() in the right bottom corner of the chart.
in the right bottom corner of the chart.
The following types of drawing can be done on the chart and are automatically stored in memory :
To perform a drawing, double tap on the chart area to open the circular menu hereunder and touch down the icon corresponding to the type of drawing.
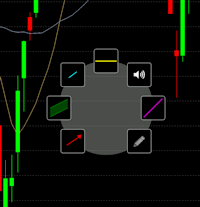
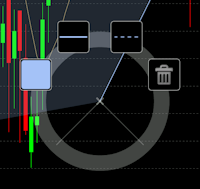
The selected drawing type is written in a label at the top of the chart. Then tap again on the chart at the origin of the drawing which will open the second circular menu hereunder to complete the drawing according to the type and to select the style.
Touch down on the external circle of the circular menu and move on the graph area. The circle center precisely defines
the extremity of the drawing in progress.
On the this second circular menu, icons are available to choose the color and style of the drawing.
When the drawing is ready, give a tap on the graph area to delete this circular menu.
To modify a drawing, select the origin, extremity or an intermediate point by taping on it. The previous circular menu will appear with its center positionned at the designated point.
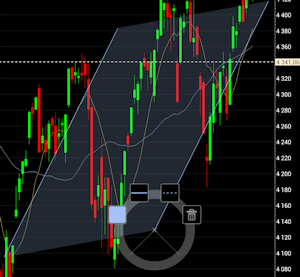
Then touch down on the external circle of the menu and move on the graph area. The circle center precisely defines the position of the designated point. When the new position is reached give a tap on the graph area to delete this circular menu..
To delete a drawing, open the previous circular menu and tap on the icon  .
.
All drawings done on the chart for a stock can be deleted at once with the corresponding option of chart menu.
To read the details of the prices (open, high, low, close and volume) at a given date,
touch down and slide on the horizontal scale of the chart.
A popup window will display these prices at the date corresponding to the vertical position of the finger.
The Real-Time Gainers and Losers Ranking Dynamic Table shows for the selected list of stocks :
On the Application main screen, touch down on the icon Gainers Losers to open the hereunder screen.
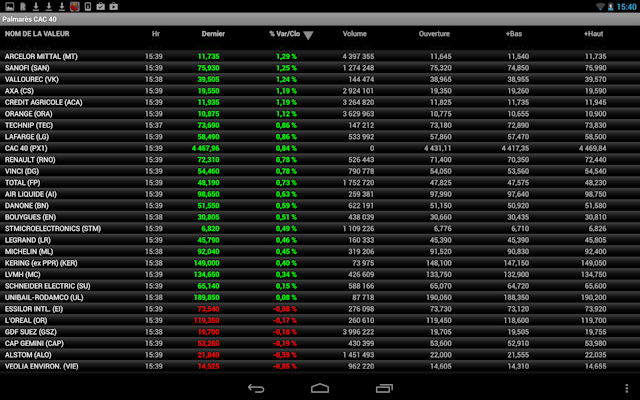
At the bottom of the screen, the Android action bar includes an icon with three vertical dots
to open the Gainers Losers menu.
The option "Lists of stocks" open a window to select a list among the lists of stock indices
and the personal lists created by the user.
Give a tap on the header of the % Var/Clo column to set the Ranking Dynamic Table in the increasing or decreasing order.
The user can create any number of personal lists each including a maximum of 50 stocks.
On the Application main screen, touch down on the icon Lists of stocks to open the screen hereunder.
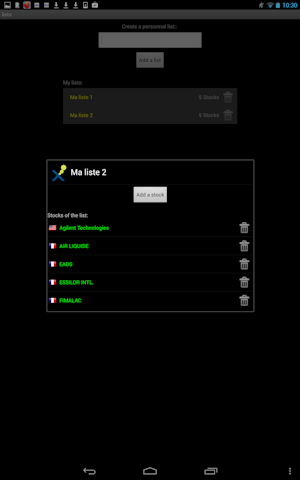
To create a new personal list, enter its name in the field Create a personal list ant touch down on the button Add a list.
The names of the lists are shown in the table hereunder together with the number of stocks in each list
as well as the icon to delete a list.
Touch down on the name of a list to open the window showing all the stocks included in the list
and eventually delete some of them by touching down on the icon .
To add a stock, touch down on the button Add a stock to open the next window hereunder :
This window allows to select the exchange and shows all available stocks. If necessary, reduce this list by entering into the search field the first characters of a stock name.
Touch down on the name of a stock in the table to add it into the personal list.
On the Application main screen, touch down on the icon Parameters to open the screen hereunder.
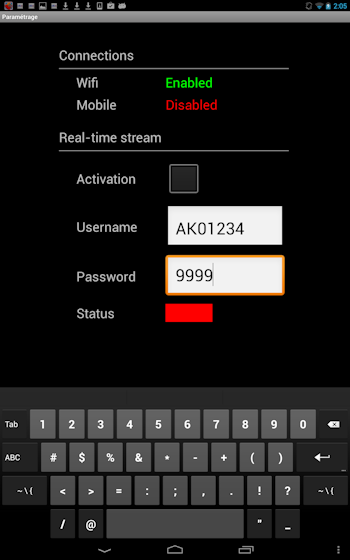
This screen shows the status of the wifi internet connection and of the mobile phone connection.
To receive real-time quotes in the application, enter the username and password given at time of subscription.
Activate the real-time stream by checking the relevant box.
The status blinks yellow during the activation phase and the turns to green when the real-time stream is working.