Technical Indicators
Parabolic SAR
The Parabolic SAR ("SAR" for Stop And Reversal) is actually a "stop" system developed by J. Welles Wilder in 1978 and presented in his book New Concepts in technical trading systems, but it is often used as an indicator.
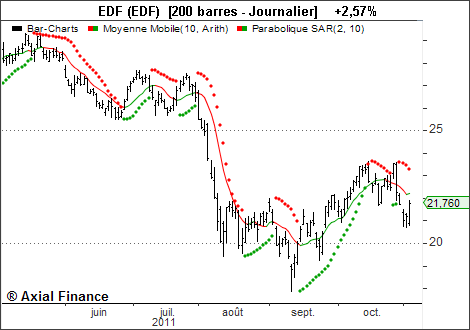
The graphical representation of this indicator resembles a succession of portions of parabolic curves, hence the name of this indicator.
This system is designed to tolerate a price variation in the opposite direction of the trend. As the trading sessions progress, this tolerance threshold reduces to tighten the "stop" level.
The SAR uses a series of progressively shorter moving averages that follow the price trend. These averages change every time the price reaches a new extreme in the direction of the trend. The SAR calculates an acceleration factor that increases by a programmable percentage (usually 2%) each time the price moves in the direction of the trend. This acceleration factor is limited to 10 times the programmable percentage.
This adaptive technique allows for adjusting a stop level progressively closer to the current price. Thus, when the stop level is breached, a new portion of "parabolic curve" begins in the opposite direction of the previous one. The starting price corresponds to the opposite extreme price reached during the previous phase.
Example