Technical Indicators
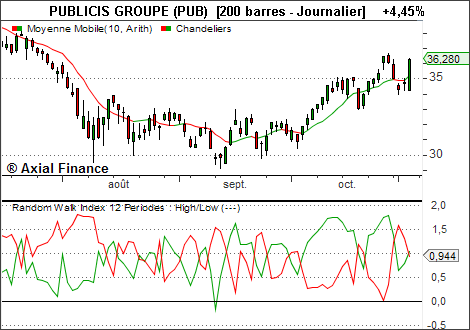
Random Walk Index
The Random Walk Index (or RWI) is both an overbought and oversold indicator for the short term, and a trend indicator for the long term.
The Random Walk Index was developed by E. Michael Poulos. For a given period, it is defined by two curves: the first based on highs and the second on lows.
Full use of this indicator involves a second set of curves of the same nature but with a different period.
The two periods used allow distinguishing between short-term and long-term aspects.
Generally, the short-term period ranges from 2 to 7 days, and the long-term period ranges from 8 to 64 days.
Calculation Method
RWI(high) = (H - Lp) / AR * (Square root of period p)

RWI(low) = (Hp - L) / AR * (Square root of period p)
where:
- p: the period
- H: today's high
- Hp: the high p days before today
- L: today's low
- Lp: the low p days before today
- AR: the average of "True Range" over the period of p days
Example