Technical Indicators
Tilson T3 Moving Average
The T3 Moving Average (or T3-Tilson) is an original smoothing indicator developed by Tilson which, according to some specialists, provides much better signals than classic moving averages.
Calculation Method
T3-Tilson = c1 * EMA6(closing price, P) + c2 * EMA5(closing price, P) + c3 * EMA4(closing price, P) + c4 * EMA3(closing price, P)
where:
- P = period
- volfactor = weighting coefficient
- EMA3(closing price, P) = Exponential Moving Average of (EMA(EMA(closing price, P), P))
- EMA4(closing price, P) = Exponential Moving Average of EMA3(closing price, P)
- EMA5(closing price, P) = Exponential Moving Average of EMA4(closing price, P)
- EMA6(closing price, P) = Exponential Moving Average of EMA5(closing price, P)
- c1 = - (volfactor)^3
- c2 = 3 * (volfactor)^2 + 3 * (volfactor)^3
- c3 = - 6 * (volfactor)^2 - 3 * volfactor - 3 * (volfactor)^3
- c4 = 1 + 3 * volfactor + (volfactor)^3 + 3 *(volfactor)^2
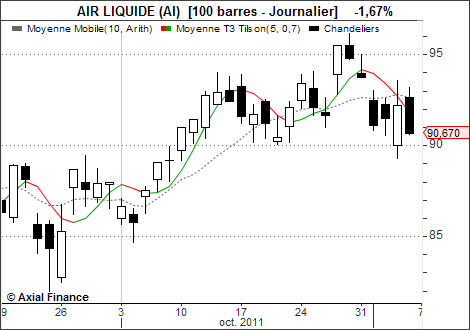
Example