
Technical Indicators
Heikin-Ashi Candlesticks
Heikin-Ashi candlesticks provide an alternative way to display price data. They were invented by Dan Valcu (some people claim it was actually the Japanese trader Yasuji Yamanaka).
The advantage of this representation over classical Japanese candlesticks
is that it visually highlights the strength and trend of the evolution. The irregularities of the classical
Japanese candlestick representation are clearly eliminated to reveal
the fundamental price movements.
Of course, this analysis should always be combined with technical indicators,
but the overall approach is significantly facilitated and results improved.
Calculation Method
  HA Close = (Open + High + Low + Close) / 4


  HA Open = (HA Open of previous day + HA Close of previous day) / 2


  HA High = Maximum(High, HA Open, HA Close)


  HA Low = Minimum(Low, HA Open, HA Close)
Example
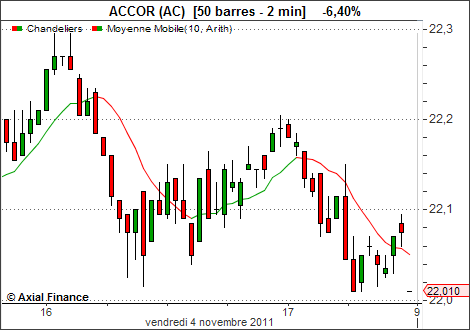
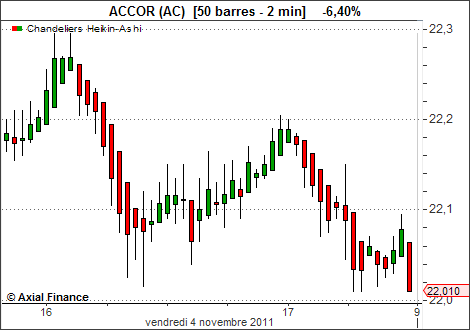
Let's compare the two representations in this example:
Classical representation with Japanese candlesticks:
Representation with "Heikin-ashi" candlesticks:
Interpretation
Interpretation is based on the following six simple rules:
- Uptrend: succession of green candlesticks
- Downtrend: succession of red candlesticks
- Strong uptrend: succession of green candlesticks without lower wicks
- Strong downtrend: succession of red candlesticks without upper wicks
- Consolidation: series of candlesticks (green or red) with small bodies and both upper and lower wicks
- Trend reversal: a single small-bodied candlestick with both upper and lower wicks