
Technical Indicators
Andrews Pitchfork
The Andrews Pitchfork, sometimes called the Median Line Method, is a graphical tool used
to analyze trend strength, support and resistance levels.
This tool was developed by Alan Hall Andrews and is used on
Bar Charts or Candlestick charts.
Calculation Method
The Andrews Pitchfork is drawn based on three pivot points:- A first high (or low) pivot point,
- the next opposing pivot point, i.e. low (or high)
- and the next opposing pivot point, i.e. high (or low)
Example
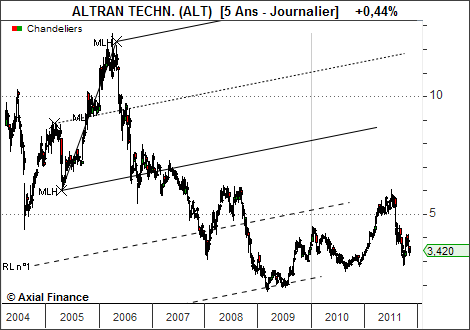
The choice of pivot points is fundamental and must be based on significant market reversals.
The basic figure consists of three parallel lines drawn as follows:
- ML: drawn from the first pivot and passing through the midpoint of the two following pivots.
- MLH: drawn from the second pivot and parallel to ML
- MLH: drawn from the third pivot and parallel to ML